Classic chart patterns [1] still work quite well, and I trade them regularly, but they aren’t the only patterns out there to watch for.
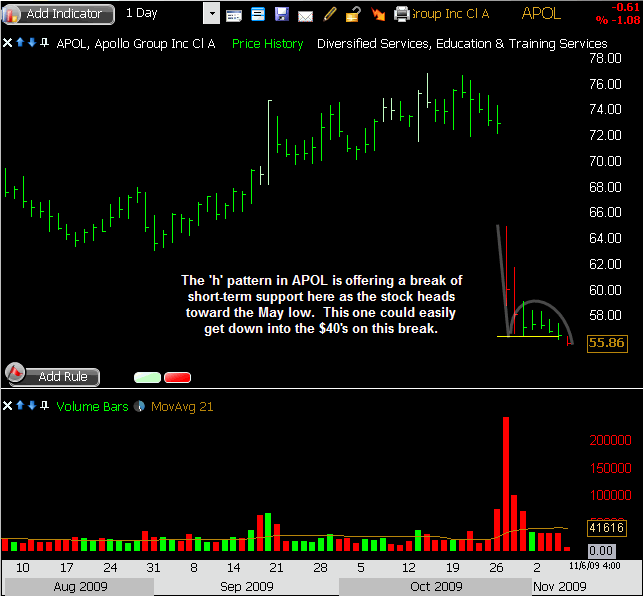
One pattern I’ve taken notice of in recent months is the ‘h’ pattern. This happens when a stock has a sudden or steep decline followed by a very quiet and weak bounce. The bounce begins to fail, and the price pattern resembles a lower-case h.
The way I trade the ‘h’ is to go short upon a break of the support level. It can offer an entry on the short side for a secondary move lower, and can carry a nice risk/reward profile with it.
APOL has this pattern right now and it’s starting to undercut support here. The stock has already been very weak since late-October, but it’s struggled to rebound. It bounced from the $55.35 level back in May, but below that the next stop could be in the $40’s.
Here’s one that’s worth a look.
Trade Like a Bandit!
Jeff White
Are you following me on Twitter [3] yet?
