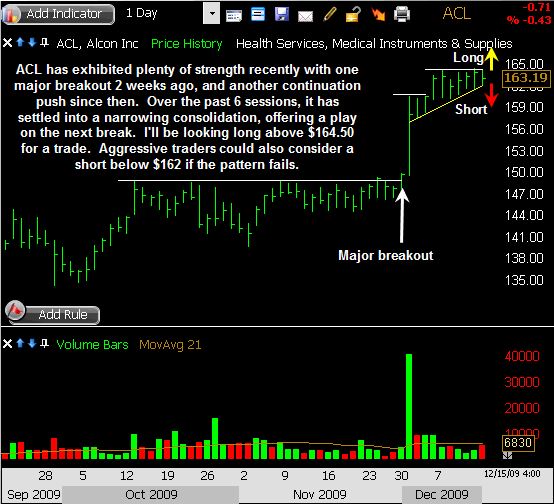
The ascending triangle pattern [1] is commonly found within uptrending stocks [2], so in a bull market like we’ve been in since March, you can spot quite a few of them.
But just because it’s a bullish setup doesn’t mean the pattern will always pan out that way. In fact, I recently discussed pattern failures [3] and the opportunities they can also deliver, so it pays to always stay on your toes.
I’ve been eyeing the chart of ACL in recent days with its ascending triangle pattern, and given the narrowness of the consolidation, this one looks like it’ll be resolved very soon.
Given that the trend is up, I’m on the lookout for continuation with a push through $164.50 as the next breakout level. However, this year I’ve seen a number of ascending triangle failures which offered some excellent signals, so it’s worth noting that if the lower (yellow) rising trend line gets broken at $162, it would be a short sell [4] signal. Either way, this one looks ready for a decent move, so it’s on my radar for a trade.
Here’s a closer look for you:

Trade Like a Bandit!
Jeff White
Are you following me on Twitter [6] yet?