I take a lot of trend line trades, as they give me a clear indication that price is either clearing an important level, or that it’s making a meaningful turn.
Recently I was asked why some of those trend lines [1] are flat (lateral), and others are tilted. Additionally, I was asked how I determine my entries on each. Here’s what I said:
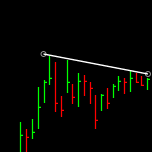
Whenever a trend line is slanted, I go with a break of the trend line itself. In the case of a bullish trend line break (a move above a descending trend line [2]), I’ll place a buy stop just above the line itself, perhaps only a couple of pennies above it. These tilted trend lines are themselves the resistance for a stock, so once they’re broken, the stock tends to be free to move higher.

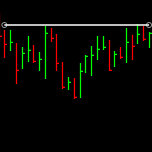
Whenever there’s a flat trend line of support or resistance [3], it’s evident that price is bumping up against a key zone which remains constant. Sometimes this is at a round number, like $100, but it doesn’t have to be. The way I trade these flat trend lines is to set a buy stop 10-15 cents past the resistance zone, as that will help to confirm I’m entering upon a true breakout that’s taking place rather than a brief penetration of only 1-5 cents which could prove to be a head fake.

When you’re drawing your trend lines, consider the overall situation. Is price struggling to clear a constant level? Use a flat trend line if so. If price is simply seeing a counter-trend pullback, then the pace of the pullback is better seen with a tilted trend line .
Trade Like a Bandit!
Jeff White
Producer of The Bandit Broadcast [4]
Are you following me on Twitter [5] yet?