 Author Archive for Jeff White
Jeff White is the founder of www.TheStockBandit.com, a nightly newsletter for active traders. He has been trading his own account for over a decade and currently trades full time in Texas.
Learning From Trading Mistakes
February 7, 2007 at 10:15 am

Bob trades online so his dumb mistakes remain anonymous.
While I’m not a backtester, I do believe that we can learn a lot as traders by reviewing our trades of the past. After all, if we can’t learn from our mistakes, how can we learn at all?
The member area of TheStockBandit.com has a feature called “Trade of the Week”. It’s a useful area that a lot of members comment on due to the lessons taught there. The T.O.W. is a look back at a trade I took each week and how it turned out. Some of them work beautifully and I get to brag a little, but the ones that we all learn from the most (myself included) are the losing trades which are dissected after the fact.
JAH is one trade I recently featured, which was a channeling stock I took for a short sale at an area of resistance. My stop loss level was close by and the stock had bounced on diminishing volume right up to the upper channel line. I went short, but the stock soon after broke above the trend line, triggering my buy stop to take me out of the trade for a small loss.
After examining the trade closely, I determined that if I were given the same setup again, I’d trade it again the same way. I just like these setups because in every case my risk is quantified with a good potential reward, and that’s the cornerstone of how I trade. However, in this case I was objective and this was one trade in which my timing was simply off. Sometimes the lessons are minor, but being willing to take something away from a closed trade is the mentality we need.
It always surprises me how even selecting just one trade per week to examine more closely helps me learn and apply that lesson better going forward. Over the course of a year, I end up being a lot smarter as a trader.
What are you doing to learn from your trading mistakes? In my next post, I’ll show you a great way to learn from your past trades which is so simple you won’t believe it.
Until then, trade well!
Jeff White
President, The Stock Bandit, Inc.
www.TheStockBandit.com
[tags]Stock Market, Trading Profits, Profit Targets, Stock Trading[/tags]
Proper Positioning for Traders
February 7, 2007 at 9:26 am
Toddo wrote a great article over at MarketWatch that I highly recommend reading. His 5 points of proactive thoughts on how to position yourself properly in today’s market is a quick read that we all stand to benefit from. Check it out, even if you only skim!
Jeff White
President, The Stock Bandit, Inc.
www.TheStockBandit.com
[tags]Stock Market, Day Trading, Stock Trading, Investing, Swing Trading[/tags]
Realities of Trading
February 6, 2007 at 12:07 am
Hope your trading is off to a good start this week!
Wanted to give you a heads-up on this week’s free newsletter over at TheStockBandit.com for my thoughts on 3 very basic but important realities of trading. I feel strongly that the acceptance of these principles can not only smooth out the equity curve of any trader, but also the psychological impact which trading can have at times.
And by the way, you can sign up for the free newsletter on the Free Newsletter page at TheStockBandit.com. An opt-in form is provided at the top of the page which puts you in full control of your email subscription at all times.
Trade well this week,
Jeff White
President, The Stock Bandit, Inc.
www.TheStockBandit.com
[tags]Stock Market, Day Trading, Stock Trading, Investing, Swing Trading[/tags]
Profit Targets: One or Two?
January 29, 2007 at 11:34 pm
I am a big proponent of planning trades as thoroughly as possible before getting in. I prefer to set my stops in one place and exit the trade all at once if I am wrong, but taking profits is another topic. At times, one profit target makes sense. Other times call for multiple profit targets.
Check out this week’s free newsletter over at TheStockBandit.com for my thoughts on planning profitable exits. And by the way, you can sign up for the free newsletter on the Free Newsletter page at TheStockBandit.com. An opt-in form is provided at the top of the page which puts you in full control of your email subscription at all times.
Trade well this week!
Jeff White
President, The Stock Bandit, Inc.
www.TheStockBandit.com
[tags]Stock Market, Trading Profits, Profit Targets, Stock Trading[/tags]
Book Review: Anatomy of the Bear
January 29, 2007 at 11:00 pm
 I love to read trading books, so when I was asked to review Russell Napier’s book, Anatomy of the Bear, I happily obliged.
In the book, Napier examines 4 major bear market bottoms on Wall St., with a portion of the book devoted to each of the major lows created in 1921, 1932, 1949 and 1982. Napier looks at the history of these bear markets, the events leading up to them, and how the investors of those times were impacted throughout the bottoming process. In his research, he examined some 70,000 articles from the Wall Street Journal from the two months before and after the final lows were made, adding some valuable perspectives from the media and traders of the day. These article tidbits give some great insights into life in the trading trenches at the time, which is incredibly helpful in painting the picture of the doom and gloom which ultimately accompanies a lasting market bottom.
Napier also takes the reader back to the situations of each of the major lows, essentially transporting you to the time and the events which led up to the bear phases. He examines wars, monetary policy, politics, economic factors, and anything else which had an impact on the buying and selling motivations of traders, making this book an incredible resource for anyone wanting to learn from lessons of the past.
Here are a few things I found noteworthy:
* Earnings Trailed Price. In the 1921 bottom, price found a low about 4 months before earnings found a bottom. Earnings bottomed some 5 months after price bottomed in the 1932 bottom. That makes for some interesting fundamental vs. technical discussion! (You know which side I’m on)
* Short Interest Stayed High After Lows. Napier discovered that short interest remained rather high even after price made a low, serving as a good reminder that even bears get greedy. In turn, as the shorts end up having to buy to exit their positions, it propels prices even higher, perpetuating the newfound momentum. Napier notes that a large short interest combined with a market that didn’t decline on bad news was an excellent signal in the 1921, 1932 and 1949 lows.
* Bear Markets Don’t Scare You Out. The results of Napier’s research flies somewhat in the face of theories which indicate that capitulation marks a lasting low, revealing instead that bear markets typically end with a final decline on no volume. Essentially, bear markets wear you out, not scare you out.
* Commodities Count. The end of commodity price declines also marked all 4 major equity lows, with copper playing a prominent role as it preceded or coincided with every equity rebound.
The book also ends with a great number of strategic and tactical conclusions drawn from the study of these 4 great bear markets – plenty of reason alone to check out this book.
Thanks to Russell Napier for the chance to review this fine study of the past, I enjoyed the read and learned a great deal from the bear markets of the past.
Jeff White
President, The Stock Bandit, Inc.
www.TheStockBandit.com
[tags]Stock Market Books, Bear Market, Stock Market Lows, Russell Napier[/tags]
When To Use Line Charts
January 25, 2007 at 9:57 am
Most of us use bar charts or candlestick charts, but you don’t see a lot of line charts these days. The reason why is that a line chart is generally drawn using only the closing level of a stock, so it paints the end result and leaves out a lot of the “noise” along the way.
Line charts do have their place in trading, and I’ll give you a good example of a time when I use them. I look through a ton of charts every night, and you might too. What you find when you do that is that you’ll run across stocks which just give you the feeling that they’re about to move a certain way. Typically, I’ll draw trend lines and look for well-defined chart patterns to provide entry and exit levels for new trades. However, some charts just aren’t clean enough to do that effectively, so I’ll switch over from a bar chart to a line chart.
Let’s look at an example of this.
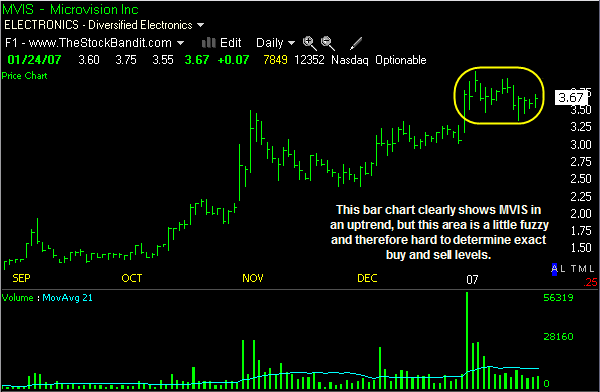
MVIS is in an uptrend, and one look at this bar chart does show higher lows along the way. The problem is, the past 15 bars or so are in sort of a messy area, making it hard to determine a precise entry and exit level without giving the stock too much room. (Click the chart below for full size)
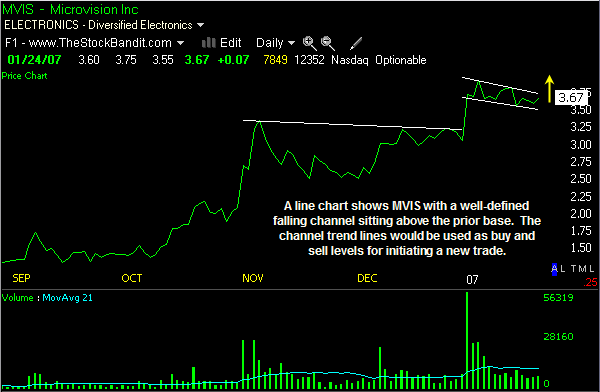
So MVIS looks good for some upside, but we can’t find an exact entry. Switch over to a line chart format and it’s amazing how much cleaner the stock looks now. We have a nice base here with this descending channel pattern, giving us a well-defined entry level and exit level (above and below the channel, respectively). (Click the chart below for full size)
The next time you have that gut feel that a stock might be gearing up for a move but you can’t pick a good spot to structure your trade, try a line chart. You’ll find the levels will often be much cleaner, and you’ll trade more effectively because of it.
Jeff White
President, The Stock Bandit, Inc.
www.TheStockBandit.com
Potential Market Shifts
January 21, 2007 at 6:33 pm
As traders, we always have to stay aware of our surroundings. Ideally, we’re seeking to maintain an edge on our competition, and that means trying to determine with some degree of accuracy what may happen next.
I’m no fortune-teller and I never make market predictions, so instead I constantly ask a handful of questions regarding the market’s behavior. With last week’s failed breakout fresh on my mind, I’m watching for potential market shifts just in case. This may only be some temporary weakness, or it may be a warning that something bigger is on the horizon – it’s just too early to know for sure yet. What we CAN do is to gauge the character of the market, and that’s what I’ll be focused on this week.
Check out this week’s Free Newsletter at TheStockBandit.com where I discuss 4 factors I use to determine market strength when watching for potential market shifts. And when you do, make up your own mind whether or not the bull in the picture looks safe!
By the way, you can sign up for the free newsletter on the Free Newsletter page at TheStockBandit.com. An opt-in form is provided at the top of the page which puts you in full control of your email subscription at all times.
Trade well out there this week!
Jeff White
President, The Stock Bandit, Inc.
www.TheStockBandit.com


