What A Breakout Looks Like
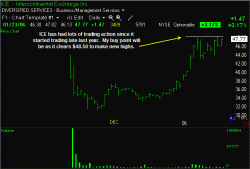
Last night in my stock newsletter, I highlighted ICE for a swing trading candidate on the long side if it could make new highs at $48.50. Here’s the chart I showed in last night’s newsletter:
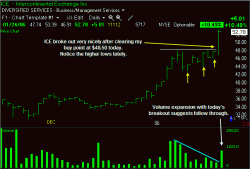
I particularly liked the recent volatility following this stock’s uptrend, along with the fact that this stock was testing the recent highs. Throw into the mix that ICE has been making higher lows in the past couple of weeks, and the ingredients of a good setup were complete. A break above the horizontal line was the entry point I showed to my subscribers, and today ICE raced higher all day long, adding more than 10% to show us a gain of more than $4.00 per share!
Here’s a look at the ICE chart after today, with the breakout very easily seen:
Don’t be afraid of trading the new issues like ICE. Just because a stock has less trading history than many others out there doesn’t mean that you can’t catch a great move out of quality chart patterns!
To catch moves like this with me instead of hearing about them from me, sign up for your 2-week free trial to my stock pick service!
Jeff White
President, The Stock Bandit, Inc.
www.TheStockBandit.com


