 All Entries Tagged With: "Chart Reviews"
Why I’m Careful Trading Drug Stocks
November 22, 2011 at 10:22 am
I’m really careful with trading drug stocks, there’s just so much to them. You have things to consider like FDA approvals, patient trials, lawsuits, huge news of positive or negative test results, etc. It can get to be a mess, and very few of those items are scheduled news, so they’re usually surprises.
That might sound exciting to some, but any veteran trader like me would tell you that surprises are not what a trading career is built on. Surprises spook us, and full-time traders like me want only to avoid them.
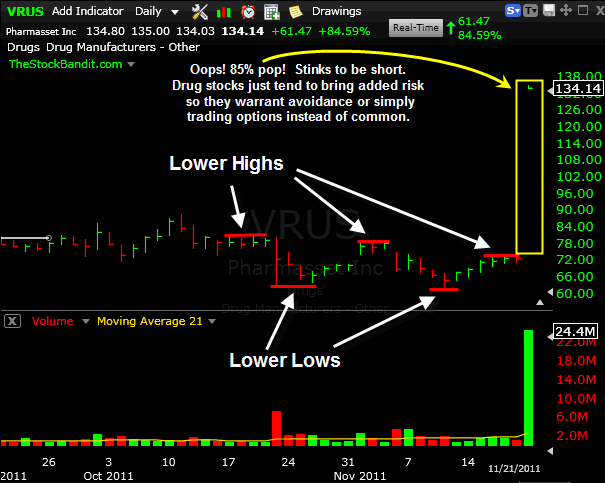
Take the buyout news in VRUS, for example, which sent the stock higher on Monday to the tune of 85%. Catching a pop like that doesn’t sound so bad, right?
Well, considering that technically the stock was set up better for a short than a long, the technical play wasn’t to be long over the weekend. The daily chart had shown both lower highs and lower lows in recent weeks. Those short would have effectively lost their entire position. Ouch!
Among other (more important) things this week, I’m thankful I had no position to begin with, but I just couldn’t help but notice the outsized gap on Monday morning.
Risk in market is required to profit, but great traders identify ways to reduce risk. Buyouts aren’t easy to see coming, but drug stocks just have too much other stuff going on anyway.
Bottom line: drug stocks are very tricky when it comes to overnight trades, so be consider the VRUS move another reason to be careful if you’re trading them (and consider options instead of common).
Here’s a closer look at the chart:
Trade Like a Bandit!
Jeff White
Producer of The Bandit Broadcast
Follow TheStockBandit on Twitter or get our free newsletter to keep up!
Post-Earnings Day Trading Profits
October 20, 2011 at 6:43 pm
 Earnings season brings with it a host of opportunities. It includes the potential for new leadership to emerge once it’s all said and done, but in the heat of it, the price action offers some excellent chances to participate in emotional short-term moves via day trades.
Traders expect big gaps during earnings season, and quite a few roll the dice ahead of it in hopes of receiving a market gift. Fortunately though, a trader need not participate in the gap itself to do well.
The post-earnings gap is a regular occurrence for most stocks, although some make a larger move than others. The outlier moves are the ones to watch closest, as they can signal either the beginning of a new move, or an overreaction with reversal potential.
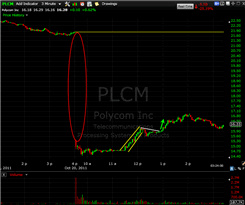
Thursday’s move in PLCM was an example of the latter, as a 30% opening gap to the downside proved to be a bit much. The stock made a huge run higher intraday, although as I’ll show in the video, catching the entire run wasn’t necessary. Instead, grabbing pieces here and there can prove quite lucrative when there’s heavy volume and high emotion present.
In this video, I’ll share with you how I profited in the stock despite feeling like I missed both the big moves (the gap and most of the upside reversal). The fact is, when a stock is in play like PLCM was, there’s opportunity for several kinds of plays along the way. And the exciting part is that this happens nearly every day during earnings season, 4 times per year.
Be sure to watch full-screen on the 720p setting for the HD version of the video.
Trade Like a Bandit!
Jeff White
Producer of The Bandit Broadcast
Follow TheStockBandit on Twitter or get our free newsletter to keep up!
Day Trading Gaps
October 10, 2011 at 4:56 pm
Day traders love to fade gaps, but it’s not always the right thing to do. In this video, I’ll point out some key traits of big gaps to watch out for when deciding on initiating gap-fill trades.
Day trading gaps can be quite lucrative, particularly when it happens early in the session. However, there’s a flip side to it which must be considered – and it costs many traders money to ignore the warnings.
Check out the video for more on this topic, and be sure you’re on the email list so you’re always notified of new updates like this one.
Be sure to view in HD (720P) and full-screen mode for best quality in the video.
Trade Like a Bandit!
Jeff White
Producer of The Bandit Broadcast
Follow TheStockBandit on Twitter or get our free newsletter to keep up!
Trading Roadblocks
September 29, 2011 at 8:12 am
 Few things are as frustrating in trading as seeing a position start to take off, only to stop or reverse. When a trade hits the proverbial wall, it stops moving according to plan and quickly becomes dead money.
Nevermind the fact that you were long in the midst of an uptrend in the stock, and in a generally strong market environment. It’s time to bail out.
What if you had seen it coming?
Looking a little farther to the left on the chart can at times enable you to do just that. Sometimes we just get so fixated on the here-and-now pattern that we fail to recognize what might lie beyond. Overhead resistance looms like a roadblock, but without zooming out on the chart, you may never see it until it’s too late.
Due Diligence
As a short-term trader, I’m all about the recent price action. I care a great deal about how a stock has moved over the past 2-3 weeks, and every day of late. I’m gauging the volume, I’m looking for clean patterns, I’m designating my trading timeframe, and from there I’m able to project where the stock can go next if those patterns are confirmed.
But I don’t stop there.
Once I’ve identified a pattern, and made the corresponding game plan, my work isn’t finished. I still need to look at the bigger picture and take note of anything that might stand in the way of this stock running further. And I’m not referring to news which might break (although that’s particularly important during earnings season). What I’m referring to is potential resistance which the stock may have to contend with shortly after confirming the short-term pattern.
Exhibit A
For example, I recently discovered a bull flag pattern. I can project, based upon the pattern, where the stock could head to next if that pattern gets confirmed. However, a look at the bigger picture showed me a glaring issue with the trade: it didn’t have far to run before the next resistance would be encountered.
That congestion zone from a few months back was a major potential roadblock for the play. Although the short-term pattern could confirm, the stock may still not get through the next resistance zone. So, this is the kind of setup I’d only consider for a day trade rather than a swing trade, because the risk I’d incur for a swing isn’t in proper relation to the limited profit I’d make if resistance holds.
Here’s a look at the stock I’ve been discussing. I’ve erased the company name and ticker symbol, because it doesn’t matter. Rather, this is an example of how I evaluate potential plays.
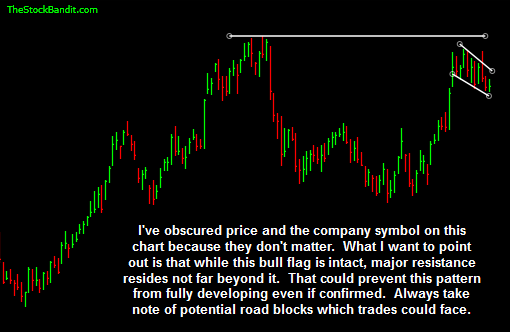
A month from now, this flag may have confirmed and the stock might blow through prior resistance as if it were never there, but that’s not for me to decide. My job is to evaluate risk, and only put my money at risk when the potential for reward outweighs that risk by a considerable amount.
Taking note of potential roadblocks like this is one way I can ensure my risk/reward on each trade remains suitable. Occasionally I might regret not taking the play, but over the long haul, I’m preserving my capital for far better opportunities.
Trade Like a Bandit!
Jeff White
Producer of The Bandit Broadcast
Follow TheStockBandit on Twitter or get our free newsletter to keep up!
When to Make Anticipatory Trades
September 21, 2011 at 9:19 am
I’m not an anticipatory trader, at least not in the establish-a-position-and-hope-i’m-proven-correct way. I really prefer confirmation of the patterns I’m seeing to trigger actual entries on trades.
But not all of us are that way all the time, and that’s alright. So I want to clarify which kinds of setups are usually worth anticipatory entries, vs. those where confirmation should be seen first.
A Step Ahead
Anyone can anticipate a move, and in the market, most try to at least once. The default starting point is flawed though, and is along the lines of “I think we’re headed higher” or “XYZ is going to $15 by the end of the year.” But those are nonsense predictions which should be left at home.
Worthwhile anticipations take into account not only current conditions, but also how they may continue to develop. They also allow for adjustments, which is a critical distinction for those who tend to get married to an opinion.
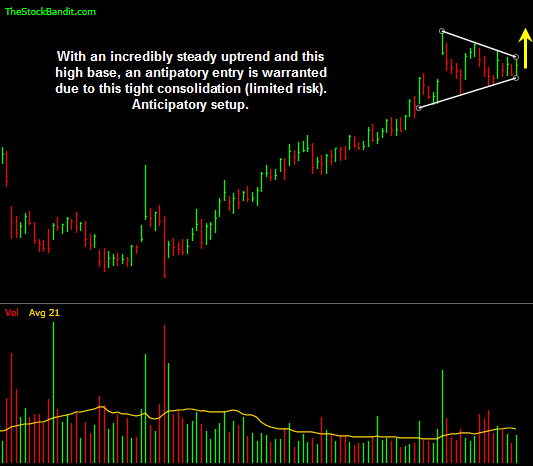
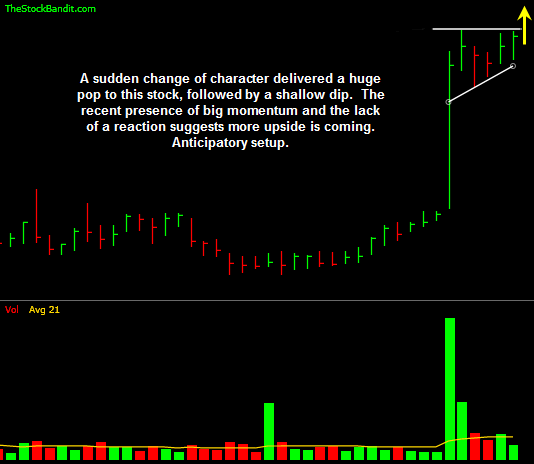
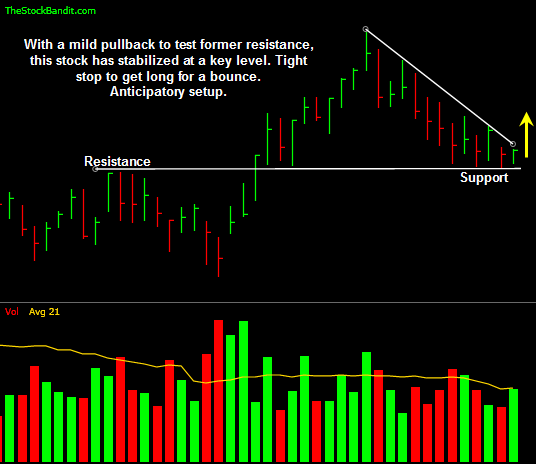
When it comes to making trades based upon anticipations, it’s imperative to stay flexible. If the plan you envision doesn’t pan out, be willing to modify it or ditch it completely. It’s also highly important to base your anticipation on the recent price action. If the recent moves give strong indications for another move, then you may have a good candidate on your hands.
These are the kinds of charts which would warrant an anticipatory play, and I’ve stripped the names from the charts so we can stay on point here with the overall idea:
Drawing The Line
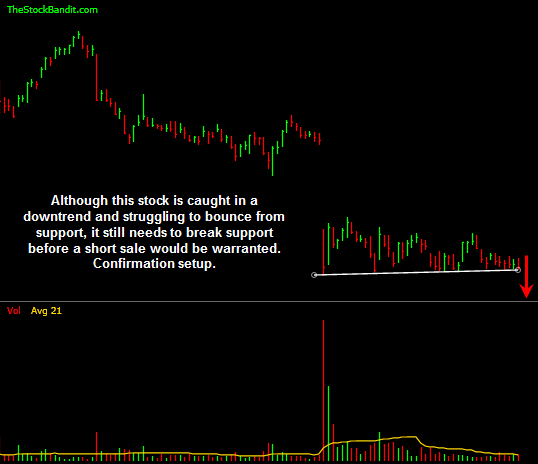
As for confirmation plays, the whole key is to wait for price to make its move and then follow suit. For example, a stock churning just beneath key resistance for several weeks might get going again eventually, but jumping in arbitrarily is more likely to result in dead money for a little while.
The way I trade confirmation setups is to draw my lines in the proverbial sand, then act if price is able to cross those lines. My actions are a response to what price is actually doing, rather than what I think price will soon do.
These are the kinds of charts I’d consider for confirmation plays, again without details so you can focus on the general idea without bias:
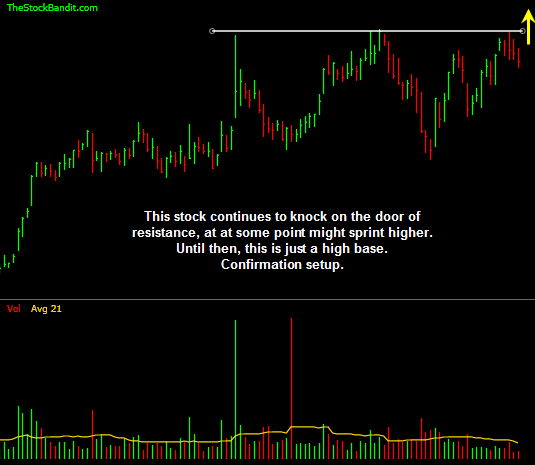
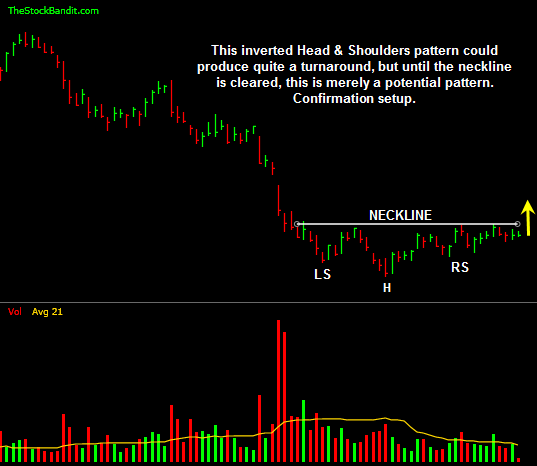
Hopefully that gives you a little better framework for your next play as you decide whether to anticipate a move or wait for confirmation. Understanding the situations which call for an early entry can prevent added frustration in a game which already has enough.
Trade Like a Bandit!
Jeff White
Producer of The Bandit Broadcast
Follow TheStockBandit on Twitter or get our free newsletter to keep up!
Lasting S&P Rally Without Banks? Not Gaah Duht
September 16, 2011 at 9:45 am
 The notion of the S&P 500 running higher without the participation of banks reminds me of Dana Carvey’s George Bush impression on SNL… “Not gaah duht.”
The financials make up roughly 14% of the weighting of the S&P 500, but they carry possibly more from a psychological standpoint. Traders are conditioned to check the fin’s when the Spoos are on the go, and lately, the participation has been downright pathetic.
Considering that the S&P has rallied within its recent trading range, we’ve seen virtually no lift from key financial names (which I’ll review shortly). With that being the case, an upside exit from the range which actually sticks (no failure) in my opinion is rather unlikely without the participation of at least most of the names below.
Let’s take a closer look at each with some notes on the individual charts, starting with a look at the S&P:
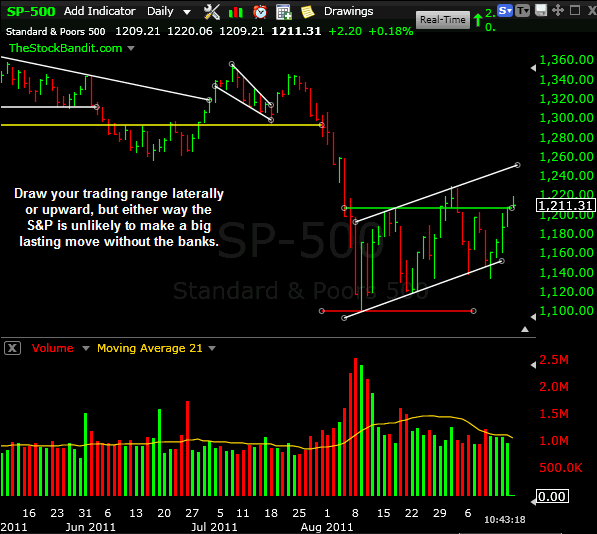
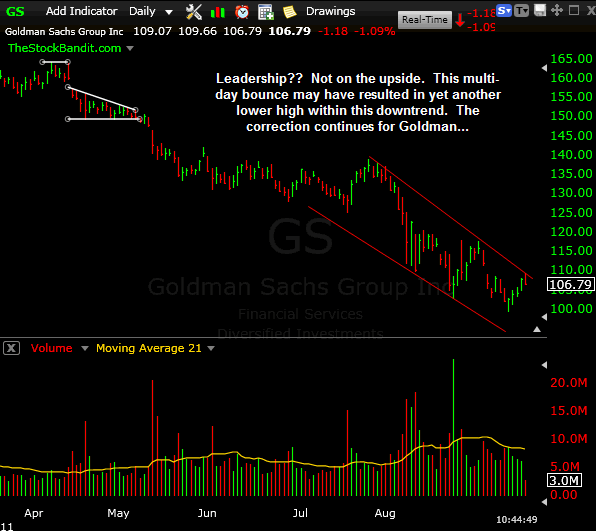
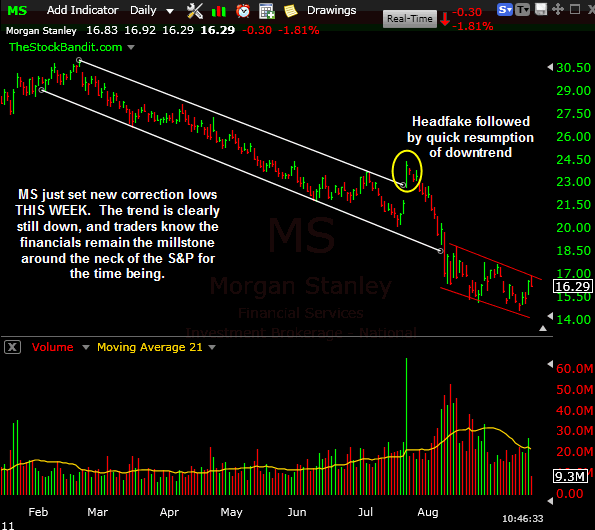
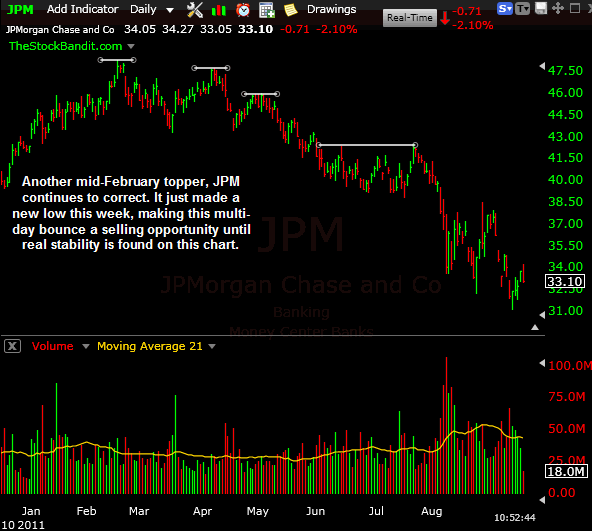
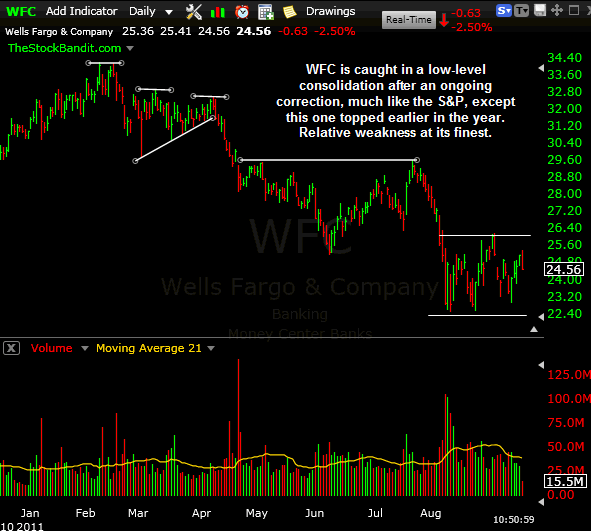
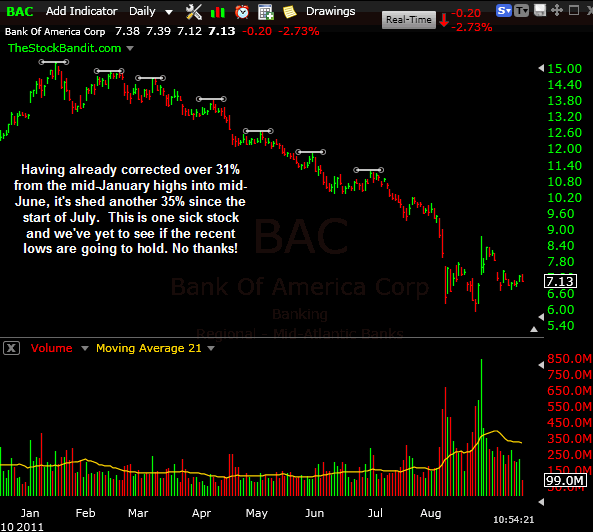
Here’s the deal…Financials need to pull their weight if this range is going to see a lasting resolution to the upside. It might happen without them, but it’s highly unlikely. Don’t take your eyes off the banks if you’re a bull.
Trade Like a Bandit!
Jeff White
Producer of The Bandit Broadcast
Follow TheStockBandit on Twitter or get our free newsletter to keep up!
Which Side Are You On?
September 2, 2011 at 8:22 am
We’re in an interesting spot here, no matter which side you find yourself on. Both the bulls and bears have reason to believe they’re going to win this one, so let’s take a brief look at the arguments of each.
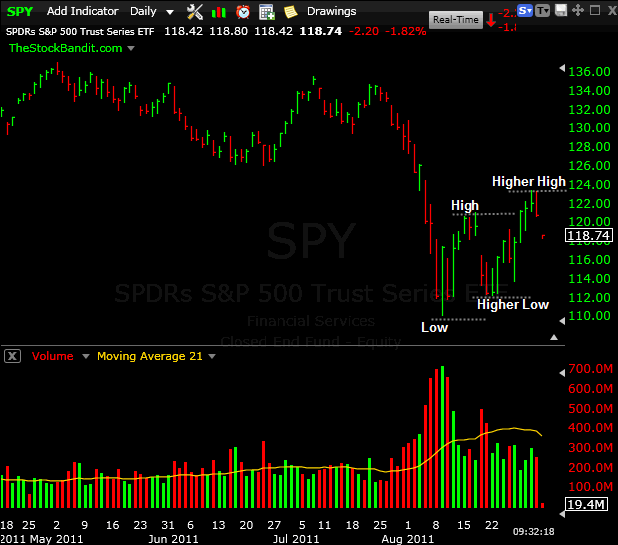
From the bullish perspective, we’ve just carved out a higher (incremental) low compared to the early-August low, which was confirmed by a higher high this week (including multiple closes above the mid-August bounce high). We’re now pulling back after a sizeable short-term run, possibly to fill the gap from 8/29. A change of direction begins with the creation of a higher low and higher high, and we’ve seen both of those get created. The worst is behind us.
Here’s the SPY daily chart with notes for the bullish case:
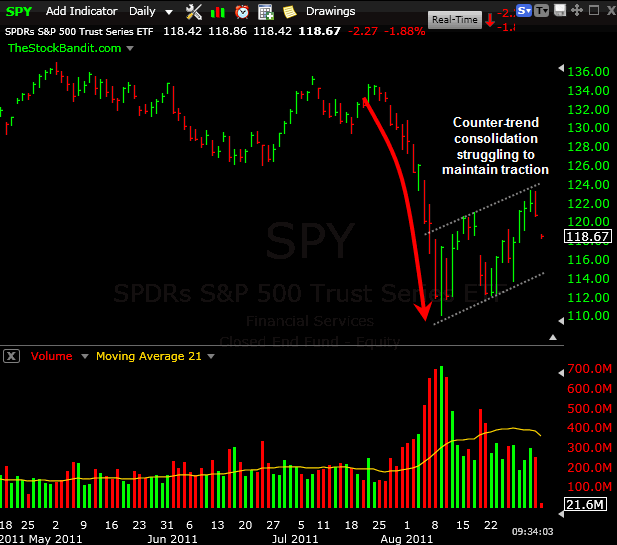
From the bearish perspective, this is a low-level (albeit wide) counter-trend consolidation following a major decline. Advances have not seen meaningful follow through…the 8/9 to 8/15 bounce was met with nearly a complete retracement, and the bounce which completed August is again coming under some pressure here. This correction is just getting started.
Here’s the SPY daily chart with notes for the bearish case:
Charts don’t lie, but at times like this it’s all about perspective. The next direction is in the eye of the beholder, and that’s exactly what makes a market. What’s your perspective?
Trade Like a Bandit!
Jeff White
Producer of The Bandit Broadcast
Follow TheStockBandit on Twitter or get our free newsletter to keep up!


