 Archive for September, 2010
One Intraday Setup That’s Working
September 28, 2010 at 9:38 am
In a world dominated by algo’s and machines, the astute trader can still turn a profit. It’s true, despite what many losing traders might tell you.
It takes adaptation, some ingenuity, imagination, and of course, thinking outside the box. For the creative trader though, new patterns will emerge from which profitable trades can be made.
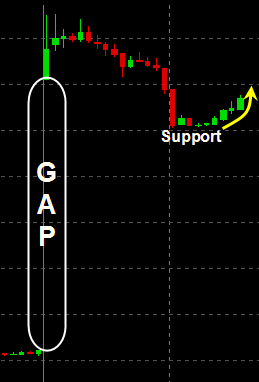
So today, I wanted to point out to you one such example. I won’t name the stock, because it doesn’t matter, but here’s the chart from the opening 50 minutes or so:
As you can see, this stock gapped higher, ran a little more initially, and then began to roll over. The selling intensified as new lows were made on the session, and the gap began to fill before a brief period of rest set in. But that wasn’t the end of the story. Conventional day trading wisdom says this gap keeps getting filled, but only if another new low is made with a break of that intraday support.
Lately I’ve noticed this kind of setup – and you can reverse it with a downside gap if you’d like – offering some good plays. I had one finger on the trigger to short sell this one upon a break of that support, but it held just above the whole number. As the stock started to catch a bid, I went long with a very tight stop – only $0.06 from my long entry. And only 10 minutes later I was flipping out my shares for a quick $0.50 winner.
** For those wondering, that’s a reward-to-risk ratio of better than 8:1.
This setup offers two things I really like…
First, it offers very minimal, defined risk. If support (or resistance in the case of a morning gap down) gives way, I’m out quick for a small loss.
Second, it offers a great pivot area where emotion is building. The battle that took place at support was really something, and once one side began to win out (in this case the buyers), it sparked a quick move away from that level.
So, keep an eye out for this setup – it’s been a great one to trade. Gaps which only partially fill before hesitating at a level just might offer you a quick, profitable reversal play like this one.
Trade Like a Bandit!
Jeff White
Producer of The Bandit Broadcast
Are you following me on Twitter yet?
Eyeing GDP for a Breakout
September 27, 2010 at 8:04 am
 There’s no shortage of bullish charts out there right now, but not all of them are in position for new buys.
One name I’m watching right now, GDP, is in pretty good technical shape here and looks like it may be gearing up for a move soon. It’s nowhere near short-term extended like so many other stocks at the moment, and in fact is knocking on the door of a breakout from a multi-month trading range.
The Plan
With GDP threatening resistance right here, it’s on my radar for a play.
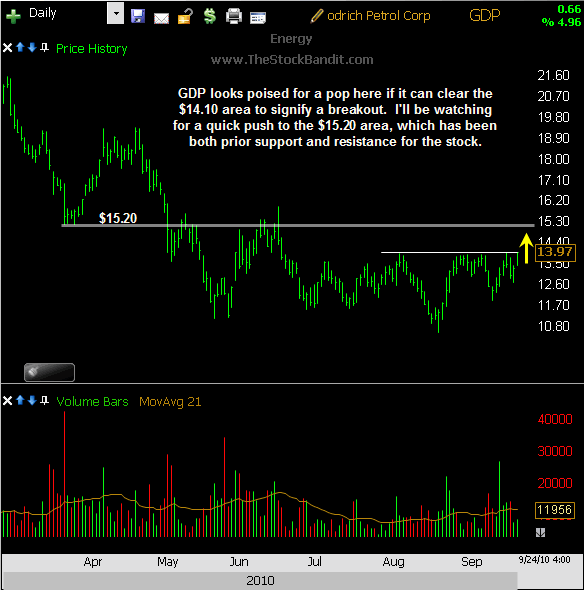
I’m looking to buy this one if it’s able to break out through the $14.10 level, and would expect a quick push up to the $15.20 area. That level has proven to be both support and resistance in the past, which makes it a logical spot for a rest if the next move carries that far.
Here’s a closer look at the chart of GDP for you:
Trade Like a Bandit!
Jeff White
Producer of The Bandit Broadcast
Are you following me on Twitter yet?
Video Review of the Indexes 9-26-2010
September 26, 2010 at 12:38 pm
Last week new highs were made as the indexes put more distance between current prices and former resistance zones. The bulls have some exceptional momentum, but how long will it last?
That’s the question on everyone’s mind right now. No signs of weakness have arrived yet, so it’s still not time to expect weakness to set in. However, at some point a good rest or some profit-taking will arrive, and it will be after that occurs that we’ll be able to better assess the technical situation. For now, it’s a one-way street and stocks are still headed north.
As we head into a brand new week of trading, let’s examine some important levels to keep an eye on in the days ahead. That will have the greatest influence on how individual stocks are going to move, so it’s where the trading week begins.
This clip was also posted over on the Trading Videos site (as always), and perhaps you’ve seen it there – but in case you didn’t, I wanted to put it here on the blog for you.
Let me suggest going full-screen for best quality in the video.
Trade Like a Bandit!
Jeff White
Producer of The Bandit Broadcast
Are you following me on Twitter yet?
Don’t Dismiss This Scenario
September 24, 2010 at 11:45 am
It’s been a big run off the August lows, there’s no doubt about it. September, as a seasonally weak month historically, has caught many off guard with this relentless ramp.
And while the market has conditioned us in recent months to expect harsh reversals rather than continuation, this time may be different.
In other words, don’t dismiss the notion of a secondary advance into the end of the year.
There are a lot of factors at play, but one of them in particular is worth taking a closer look at. I put out an article earlier today that discusses The Case for a Year-End Rally, and wanted to be sure to let you know about it.
A pressing motivation for some is fast approaching, and it could prove to be a game-changer for what has been a range-bound market. Keep an open mind…
Trade Like a Bandit!
Jeff White
Producer of The Bandit Broadcast
Are Sellers Looking for a Catalyst?
September 21, 2010 at 8:44 am
Anytime we see market streaks emerge, we know someone’s been caught on the wrong side.
Monday’s session marked the 12th advance in the previous 13 trading sessions for the NAZ, including nine straight. Breakouts happened across the board, with the summer highs being cleared on solid volume. It almost feels like stocks may never decline again – and that’s a dangerous way to think.
The market will humble traders of all kinds, including bulls who become overconfident. It may not be a life-altering lesson, but in a tape like this, it could be one slip that brings a sudden pullback – even if it’s a brief one.
The technical picture is positive, there’s no doubt about it. We just established higher lows in August relative to July, and we just made higher highs. That’s a shift of trend, not only in the short term of the past couple weeks, but in the intermediate term of the past few months. The bulls are sitting pretty.
Things start to get really tricky though when momentum begins to run a little too hot, which is where we are right now. All news has been good news of late, and the buyers have dumped cash into this market relentlessly since the start of September. It’s been an impressive run, no matter how you slice it.
For a reality check, however, it’s safe to say that all the easy money has been made for this run. The pace is unsustainable, plain and simple. We could push higher from here, there’s no rule to prevent that from happening, but it’s far more likely that we’ll see some profit-taking kick in sooner rather than later. Those who are sitting on profits will be quick to lock them in at the first sign of weakness.
When it comes to excuses, the market is excellent at finding them. Right now, my hunch is that the bulls are needing an excuse to satisfy their urge to lock in at least some of their gains. And with a few key events on the horizon, it’s important that you and I stay on our toes.
Today’s FOMC meeting may be the first possible excuse for some profit-taking. It may not even matter what the Fed does or says – what matters is how the market responds to the news. And if it isn’t today, then there’s plenty of economic news slated for this week which could prove to be a market-mover.
So, I’m on the watch for a possible pullback. If I were predicting, I’d already be short – and I’m not. Instead, I’m watching carefully to see if some selling kicks in, which would then set up a favorable risk/reward scenario for a little round of selling. Here’s my game plan:
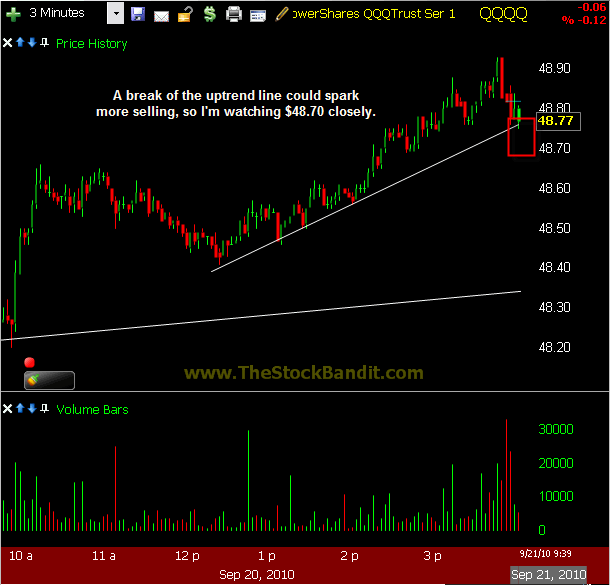
The QQQQ has rallied big, not only in recent weeks, but on the intraday chart as well. We have steep uptrend lines on both the daily and intraday charts, and I’m watching them both for downside breaks. First, let’s take a look at the intraday chart. Monday’s advance was smooth, and a break of the rising trend line at $48.70 would likely spark some selling. I’ll go short there with a stop in the $49 area, just above yesterday’s high.
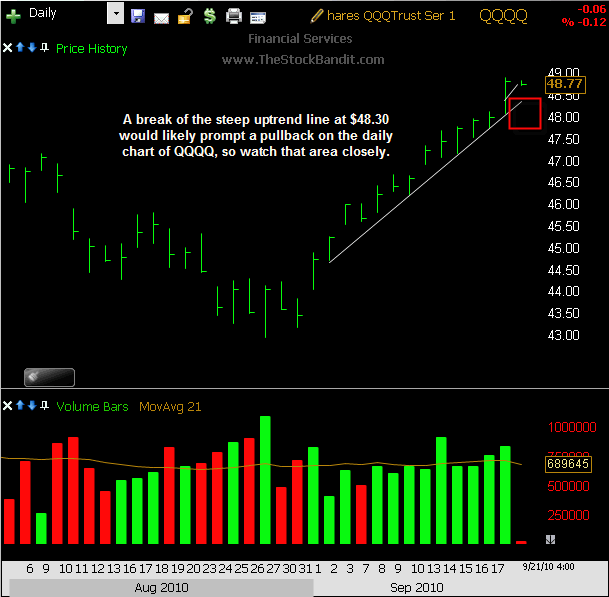
On the daily chart, there’s also a steep rising trend line. A break of that wouldn’t necessarily mean price goes straight down, but it may be a worthwhile short for the nimble to catch the first move. The rising trend line currently stands around $48.30, and a break of that level could bring into play a multi-day pullback. Traders watching the daily chart should keep that level front and center today, and it will climb daily should this market happen to continue advancing. Once it’s broken though, the move could be a swift one to the downside for a quick trade.
Trade Like a Bandit!
Jeff White
Producer of The Bandit Broadcast
Watch JKS for a Lower High
September 16, 2010 at 7:17 am
The run in solar stocks has been an impressive one, although some have gone too far.
One name in particular, JKS, has become rather extended in the near term and is starting to show some telltale signs of fatigue and exhaustion.

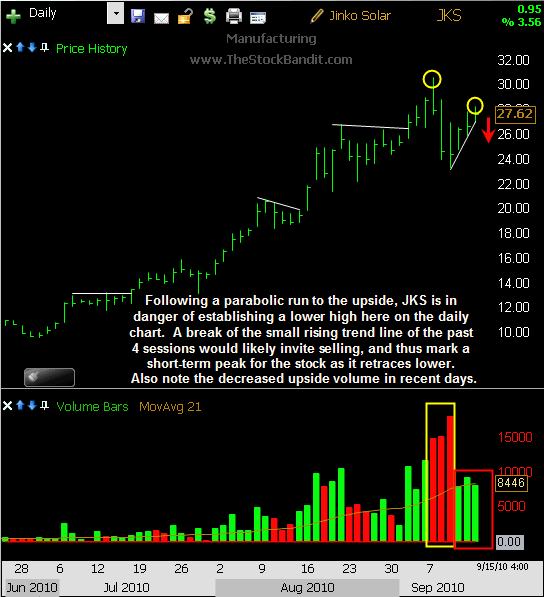
Having run from the single digits in July to over $30 last week, this one has plenty of room to correct. The parabolic uptrend may have ended with the combination last Wednesday of new all-time highs and a reversal to finish negative on the day with heavy volume. We then saw downside follow through Thursday and Friday, with the stock dropping a quick 23% off its high.
Since then, it’s been able to rebound slightly, but there are a few issues with how it has happened.
First, price has only recovered a portion of what was given back. Those who bought near the peak are still under water, and therefore could rapidly become sellers if this bounce fails to continue.
Second, the upside volume of the past 3 sessions is still only about half of the heavy downside volume which accompanied the Wed-Fri pullback last week. That’s a negative price-volume divergence, and with this stock possibly topping, it’s definitely worth noting.
Finally, although the stock has recorded advances in the past couple of sessions, the finishes have been weak. Looking closely at the daily chart, the closing level on both Tuesday and Wednesday was well off the session high, indicating a lack of vigor on this bounce.
The Plan
With JKS in danger of creating a lower high on the daily chart, I’m watching the rising trend line like a hawk. This one has ample room to come in, should some selling arrive, and therefore it belongs on the radar for the next day or two in case the reasons for caution listed above causes another round of selling to materialize.
I’m looking to short sell this one if it undercuts the rising trend line, which currently stands near $26.90 and climbs daily. A break of that level could invite additional selling to enter the picture, and we could see the air get let out of this one rather quickly if last week’s slide is any indication.
Here’s a closer look at the JKS chart for you:
Trade Like a Bandit!
Jeff White
Producer of The Bandit Broadcast
Are you following me on Twitter yet?
A Good Time to Lighten Up
September 13, 2010 at 11:32 am
As I watch the action today, there’s reason to be impressed. Heading into today’s session, the market had posted gains in 6 of the past 7 sessions, and had moved right up to (or through in some cases) key resistance zones.
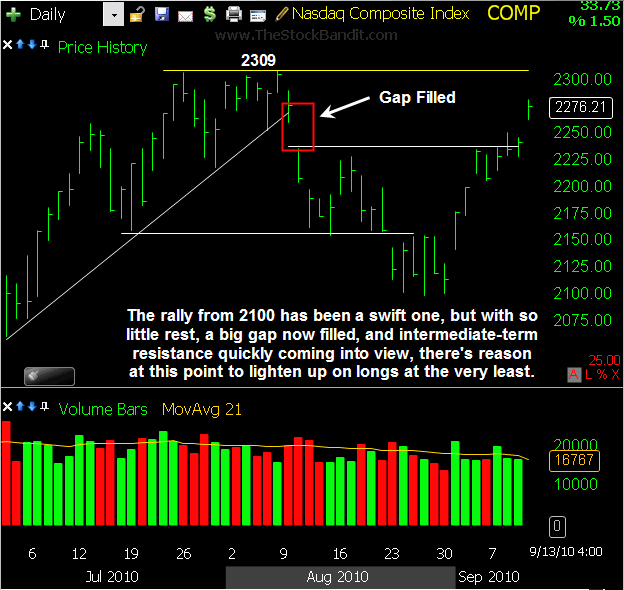
That would have been a very logical spot for some profit-taking, or at least some rest to kick in, but so far today all we have is more strength as the market tries to make it 7-of-8. Each of the major averages have pushed through their respective resistance levels. The NAZ has filled its gap to 2277 from 8/11 and the August high isn’t much of a stretch from here. The S&P 500 has motored well beyond 1107 and is just a few points from big resistance near 1130. The DJIA is through 10,480 and only a short distance from former resistance and the broken uptrend line at 10,600. And the RUT is now well past former broken support at 639. Needless to say, the longer-term technical picture is looking far better than it was just a couple of weeks ago.
Look to the Left
But that doesn’t mean the bulls are in the clear. Not in the intermediate term, at least until the August highs are cleared. And not in the short term, given that this move is becoming extended.
Momentum in the market is a funny thing, because it can be completely absent and then suddenly dominate the tape. The buyers have momentum right now, and I’m not in a hurry to fade that. But at the same time, I’m also in no hurry to chase it. In the past several months, we’ve seen plenty of moves of similar magnitude to that which has occurred since August 31st, and a number of them have delivered at least short-term reversals. Piling on in expectation of immediate continuation has not been a strategy that has paid well.
As a technical trader, I let the charts guide me. I watch for patterns and trends, yes, but I also must monitor the overall behavior of the market – the habits of the price action, if you will. At some point, continuation beyond multi-day moves will become more commonplace, but if recent history is any gauge – and particularly with major levels looming just overhead – my inclination here is to be more cautious than aggressive.
A Little Caution Goes A Long Way
For those who are bulls, I think better prices will arrive for getting long. For those who are bears, there is no proof yet that this bounce is over. And all of that leaves me feeling that doing less here is best – at least until some rest is seen.
If you’re seeing some good trading opportunities out there for the shortest of timeframes, there’s probably no harm in taking them. But for a multi-day timeframe, I am not a buyer in these conditions and would much prefer to see a pullback or some rest before considering longer-lasting trades on the long side.
Here’s a look at the NAZ, which has moved more than 8% off support in just 8 sessions – is that really sustainable?
Be careful out there.
Trade Like a Bandit!
Jeff White
Producer of The Bandit Broadcast
Are you following me on Twitter yet?


