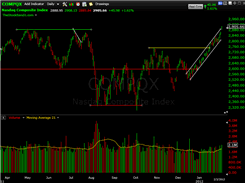
Video Review of the Indexes 2-5-2012
 Following some healthy basing action in the previous week, we saw stocks head higher once again last week, continuing the 7-week uptrends.
The NAZ tagged 11-year highs, while the other indexes approached key levels from 2011. All news is good news these days, and it seems stocks may never decline again. Careful though – be sure to manage risk accordingly on new positions after a run of this magnitude. Could be that the first pullback is a good one with so many looking to lock in profits at some point.
In preparation for the trading week ahead, let’s examine some important levels to keep an eye on for the indexes. That will have the greatest influence on how individual stocks are going to move, so it’s part of our Sunday process.
(Direct video link is here for those interested in embedding it elsewhere to share).
Be sure to view in HD (720P) and full-screen mode for best quality in the video.
Trade Like a Bandit!
Jeff White
Producer of The Bandit Broadcast
Get our free newsletter to keep up!
Follow @TheStockBandit


Mark | Feb 7, 2012 | Reply
Jeff, I’m new to trading (since Christmas). I’m wondering how important long term resistance levels are. I suppose it depends really on the market conditions. A skittish market probably respects them more. This market seems to be ploughing on through them regardless. The NASDAQ now, is free and clear of them with its breaking through the eleven year high, unless it goes down again.
The reason I am asking is that I use Stockcharts.com for my charts (I’ve given up on TC2000, It’s a great program but no real-time information for Canadian stocks which is all I trade). There are lots of stockcharts.com features that I like, but it isn’t possible to change the timeframe easily (TC 2000 you just scroll back with the mouse wheel). I’m therefore sticking to a 4 1/2 month chart and ignoring any information older than that. It simplifies things and I wonder how far back people really remember. I also am thinking the older the resistance/support level, the less significant it is. Do you think I will be ignoring less recent history at my peril? I also find that the more information I bombard myself with the less clarity I have.
Thanks
Anonymous | Feb 7, 2012 | Reply
Hey Mark,
Great question and this really deserves its own blog post so I’m glad you asked. To answer you though, here’s my take on it.
Technical levels are representations of buyers and sellers, which often times are made based on emotions. The older the level, the less emotional significance I’d attach to it. More recent levels are fresher in terms of emotion, and therefore tend to get respected to a greater degree.
I’d say anything inside 18mo or so is game, whereas I place lower significance on multi-year levels. They may be noticed by technicians, but anyone who has held for 11yrs in the case of the NAZ isn’t likely to bail out now that they’ve finally gotten their money back – I think they’re the “invested” crowd who never intends to sell.
Hope this helps!