Under Armour Over Achieving
Relative strength is always applicable when comparing a stock with the overall market, or with its competitors.
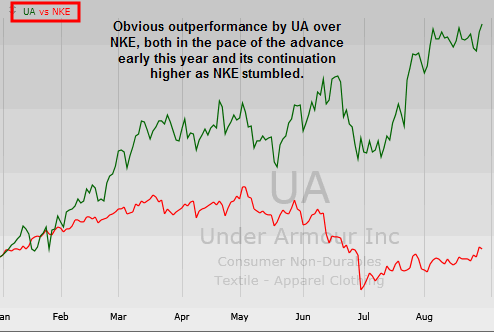
In the case of UA, we’ve seen clear outperformance and plenty of relative strength compared to its senior rival, NKE. Since the beginning of the year, UA has tacked on 61%, while NKE has added a measly 2%.
Here’s a comparison chart of UA vs. NKE for 2012:

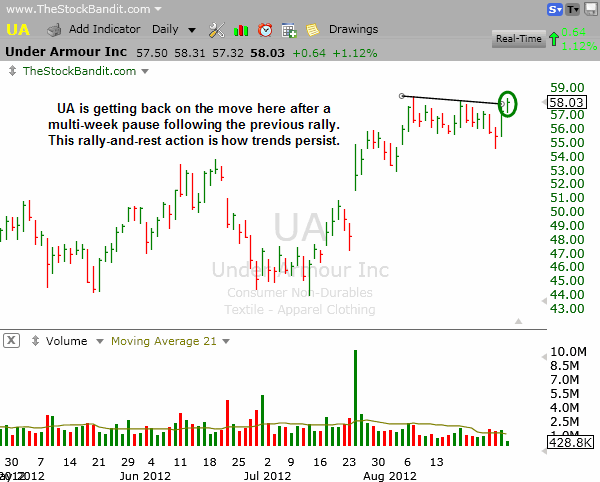
While UA has had an already impressive year, it has come with a few bumps in the road and the occasional swift pullback. However, overall the chart looks excellent on the year with an early rally, a mid-year trading range, and some continuation higher since late June. Today it’s clearing a short-term trend line from the past few weeks as it challenges the 52-week high. Needless to say, it looks poised to add to its YTD gains.
Here’s a closer look at the chart of UA for you:

Trade Like a Bandit!
Jeff White
Subscribe to our Stock Pick Service to get our trades.


