 All Entries Tagged With: "Stop Loss"
Walk Away from Your Day Trades
January 17, 2012 at 10:44 am
Intraday plays can offer exceptional opportunities for not only capturing quick moves, but also for managing risk by avoiding the overnight gap risk. It’s a timeframe which full-time traders often participate in, but one which the part-time trader often avoids due to a perceived inability to manage the trade effectively.
 With today’s trading technologies available to us all, there’s no longer an excuse for missing out on moves when away from your screens. The bracket order is a well-known device for the set-it-and-forget-it type of trade, but there are aspects of it which few utilize.
I’ve realized through helping so many part-time traders who desire to capture some intraday moves that it’s common to simply think inside the box. Most of them view a bracket order as an entry, a stop, and a limit order (set at the target). That’s not at all a bad way to do it, and in fact it’s exactly how I use brackets on my swing trades.
Get Creative
For day trades and the bracket order, a little creativity can go a long way. Mix up the parameters from the usual bracket order you use and throw in a couple of different variables.
One of your stop choices is the trailing stop, which can be excellent for intraday trading. This order allows you to designate either a percentage or a price amount which the stock would have to retreat from its best level (since the trade was entered) in order to trigger a closing order. For the trader seeking to grab as much of an intraday trend as possible, this is a great option to have available – particularly in momentum names which have the ability to keep running.
Another choice which can be made is the time stop for managing exits. This order is based on the clock, so once a given time of day is reached, the next action can be triggered (sell!). Since the whole idea of a day trade is to capture intraday movement and not hold overnight, consider setting a time-triggered order to exit the position ahead of the closing bell.
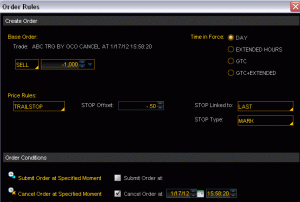
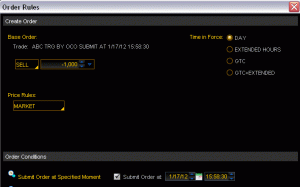
Here’s what the basic order structure would look like on the thinkorswim platform with a stop buy entry if ABC clears $50, with a trailing stop of $0.50 and a time stop for a market sell late in the day (click to enlarge image):
The trailing stop is set to cancel 10 seconds before the time stop, just for the safety of not having the orders overlap (even though there should be no issue). I clicked the little gear icon beside the order on the far right side of the image above, then selected ‘Cancel order at Specified Moment’ and designated an exact time to cancel the trailing stop (click to enlarge):
The time stop is simply a market sell order which will go live at the designated time, in this case 90 seconds before the closing bell. Again, clicking the gear icon brings up this dialogue box where I simply checked ‘Submit Order at Specified Moment’ and set the time (click image to enlarge):
The bottom-line lesson is this: even as a part-time trader, you can still participate in some intraday moves. Use the technology which is at your disposal, and think outside the box a bit. It can help you manage risk effectively, and if the trade works you can lock in some solid profits – without sitting at your desk!
Trade Like a Bandit!
Jeff White
Producer of The Bandit Broadcast
Follow TheStockBandit on Twitter or get our free newsletter to keep up!
Portrait of a Short Squeeze
January 9, 2012 at 10:47 am
WTW was in a clear downtrend. The stock had failed in early-November to clear late-October resistance, and subsequently reversed lower. Each bounce was sold since then, with a series of lower highs and lower lows.
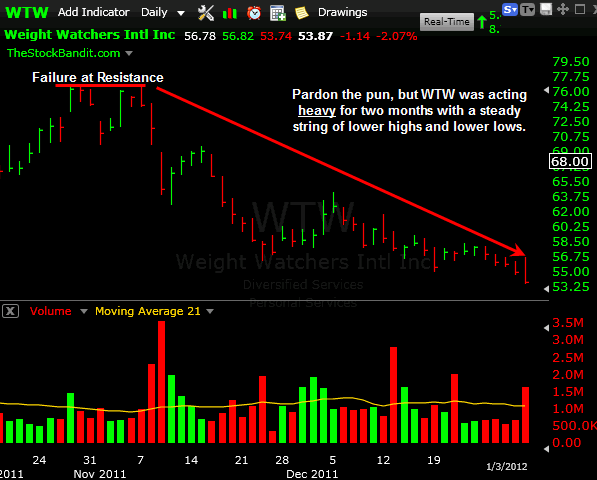
Last week, the stock broke to a new correction low by undercutting the December lows on heavy volume. What followed, however, was obviously both shocking and painful for the shorts.
Wednesday’s arrival delivered upbeat news for Weight Watchers as U.S. News & World Report put it at the top of the list for best weight loss diets in 2012. Consequently, Wednesday’s bar was a bullish engulfing bar as Tuesday’s low was undercut before a close above Tuesday’s high on even heavier volume with a 7% pop. Then we saw near-record volume Thursday on an 8% advance, and further upside continuation Friday with nearly a 9% gain.
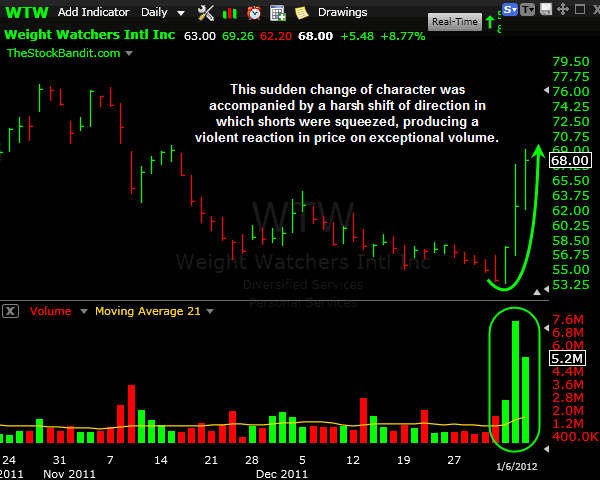
Change of character? Absolutely. Value-buyer accumulation? Hardly. This is the portrait of a short squeeze, and it’s one reason shorts require absolute stop losses. The sudden shift can rip the faces off of shorts who panic and rush for the exits while opportunistic bulls get long. The combination can be explosive, as seen here in WTW.
The lesson? Watch your shorts and don’t give them more leeway than they deserve. Keep stops in place and be mindful of what’s possible when the tide shifts. This is one kind of move you don’t ever want to experience from the wrong side of the trade!
Trade Like a Bandit!
Jeff White
Producer of The Bandit Broadcast
Follow TheStockBandit on Twitter or get our free newsletter to keep up!
Market Makers, Specialists, and Stops
October 28, 2011 at 9:40 am
A subscriber recently asked me:
“Do you believe market makers and specialists really gun for the orders that are on the books that are only a few hundred shares, or do they only search out bigger size?”
Here’s my response:
 My take on market makers and specialists is that they just want volume, all day, as they’re selling on the offer and buying on the bid. A few hundred shares here throughout the day add up to a lot. Stocks will naturally gravitate toward key areas of support and resistance, so if they just get close then it’s not that difficult for market makers to ‘spook’ prices a little further and run some stops.
Suppose there’s resistance just a few cents away, they know buy stops reside beyond that level. Flashing a big bid will have shorts quickly covering based upon the quote (which is real by the way), and buyers step in front of it in hopes of catching a run. They can then flip that large order to the ask and it spooks everyone to sell, taking the stock right back down to where it was.
You can see how doing that throughout the day adds to the back-and-forth range-bound type of price action which churns the accounts of retail traders and leaves the stock not necessarily making any big headway.
Also, do not discount the presence of programs doing this exact same thing. If supercomputers can automate the process via algo’s, all the better for the smart money to spook the retail traders out of positions on a regular basis. Head-fake moves which last only long enough to inflict enough pain to prompt an exit is all it takes, so it need not be a lasting move to catch the small trader off guard and separate him from a dime here or a quarter there.
One last thing…
On a trend day when market makers are shorting into strength (selling on the offer during an uptrend ), if they didn’t have a lot of inventory to dump, then they’re getting shorter the higher we go. They will hedge via futures (ES or NQ) or through options. Those derivatives have a huge impact on how the market moves, yet few traders really recognize that.
So when people watch call buying activity or put buying activity in the options, they think they know that someone big is betting on a rise or fall in the shares, but the fact is nobody knows if it’s that simple or if it’s part of a more complicated hedge for a market-neutral position.
It gets cloudy, but there’s my take on market makers and specialists. What’s your opinion?
Trade Like a Bandit!
Jeff White
Producer of The Bandit Broadcast
Follow TheStockBandit on Twitter or get our free newsletter to keep up!
Post-Earnings Day Trading Profits
October 20, 2011 at 6:43 pm
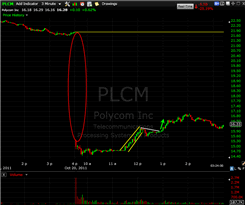 Earnings season brings with it a host of opportunities. It includes the potential for new leadership to emerge once it’s all said and done, but in the heat of it, the price action offers some excellent chances to participate in emotional short-term moves via day trades.
Traders expect big gaps during earnings season, and quite a few roll the dice ahead of it in hopes of receiving a market gift. Fortunately though, a trader need not participate in the gap itself to do well.
The post-earnings gap is a regular occurrence for most stocks, although some make a larger move than others. The outlier moves are the ones to watch closest, as they can signal either the beginning of a new move, or an overreaction with reversal potential.
Thursday’s move in PLCM was an example of the latter, as a 30% opening gap to the downside proved to be a bit much. The stock made a huge run higher intraday, although as I’ll show in the video, catching the entire run wasn’t necessary. Instead, grabbing pieces here and there can prove quite lucrative when there’s heavy volume and high emotion present.
In this video, I’ll share with you how I profited in the stock despite feeling like I missed both the big moves (the gap and most of the upside reversal). The fact is, when a stock is in play like PLCM was, there’s opportunity for several kinds of plays along the way. And the exciting part is that this happens nearly every day during earnings season, 4 times per year.
Be sure to watch full-screen on the 720p setting for the HD version of the video.
Trade Like a Bandit!
Jeff White
Producer of The Bandit Broadcast
Follow TheStockBandit on Twitter or get our free newsletter to keep up!
Day Trade or Swing Trade? Progression of a Play
July 26, 2011 at 11:21 am
One of the things I’m asked about quite often is how I decide my timeframe for a good setup. Will it be a day trade or a swing trade?
That’s a great question, and it took me a long time to figure that out. I go in-depth in the Advanced Trading Course at TheStockBanditUniversity.com to explain it fully, but one component in the decision is the pattern quality. That’s going to encompass the risk associated with the trade, which means entries and exits are more defined by a cleaner, mature pattern vs. one which is simply building.
So rather than just talk about it, I wanted to show you an excellent example from last week of how a stock can go from being simply a day trade candidate to a swing trade candidate when the pattern matures.
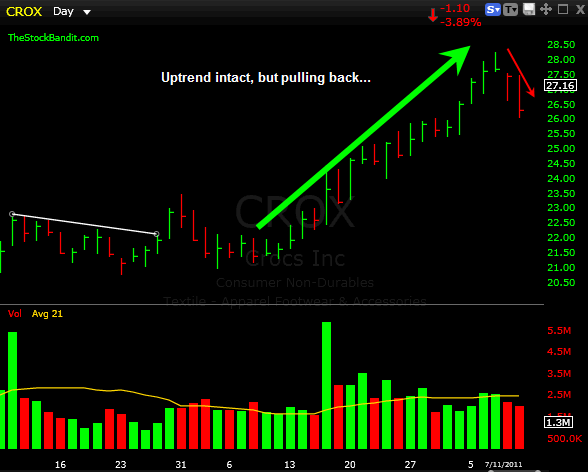
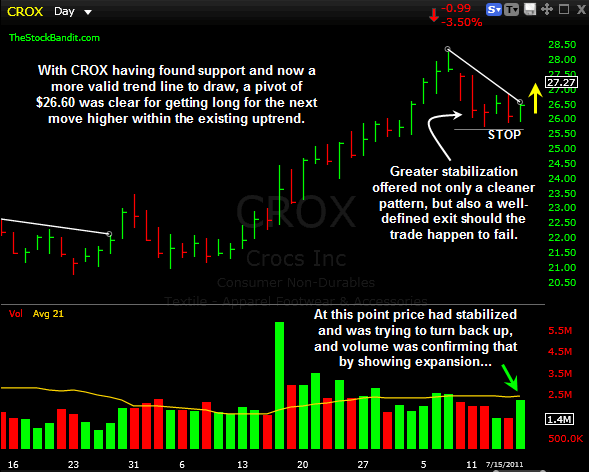
I had run across CROX pulling back from its 7/7 high on 7/11. The uptrend was still very much intact, and this looked to be a potential dip to buy once the dip was completed. Here it was at that time:
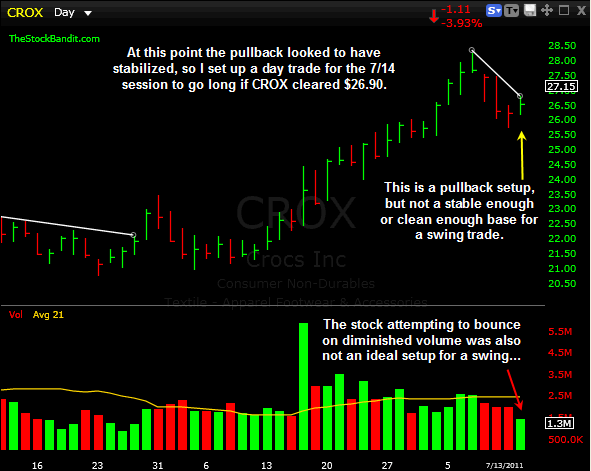
CROX needed to be watched a little longer before a play was evident, as I wanted to be able to draw a clean trend line along the highs and then go long on a push through that trend line. Sometimes you have to wait on the market. It took a couple of days, but I finally listed it for subscribers on the night of 7/13 for a day trade the following day. It wasn’t a fully mature pattern, so I was only interested in grabbing the next pop if it occurred the next day (7/14). Here was the setup, which didn’t trigger (it stopped a few cents shy of clearing the trend line, therefore no trigger):
Despite not triggering an entry for a day trade, I kept CROX on the radar nonetheless. After two more daily bars had been painted on the chart, a cleaner trend line could be drawn, and the pullback had the appearance of greater stabilization. I then set up a swing trade since the pattern was more mature, the pivot was more evident, and a stop loss area was now well-defined. Here was the setup I posted for subscribers along with a $26.60 entry trigger price, a $25.70 stop loss (just beneath newfound support), and upside targets at $28 and $29:
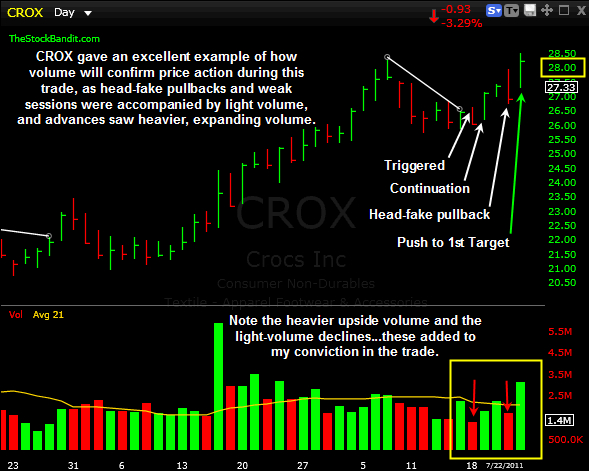
From there, CROX triggered an entry on 7/18, dipped for a day on weak volume, then got back on the move. With Target 1 at $28, the stock stopped just a few cents shy of hitting that level on 7/21, creating a bearish engulfing bar. However, I stayed with the trade since volume didn’t confirm distribution, and the following day the stock blew through the $28 first target on much heavier volume.
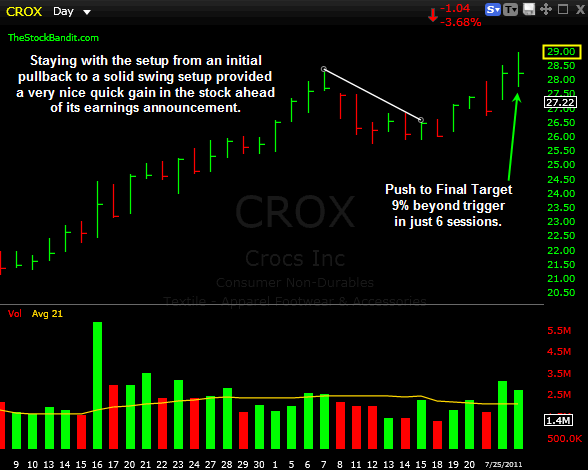
CROX pushed all the way to Target 2, topping out exactly at $29 on Monday. That offered a nice quick 9% gain, allowing me to book a solid profit ahead of the August 1st earnings announcement (which I always avoid). Here’s a look at the final bar of my trade:
Several takeaways…
Allow setups to determine your trade timeframe. I’ve said it many times, but the smaller the pattern, the shorter the trade should last. Bigger patterns can be trusted for more, it’s just that simple. This started out as a day trade candidate but evolved into a swing trade setup after the pattern grew and matured.
Be patient as patterns build. I stalked this stock for several days before placing a trade. Waiting for stocks to “come to you” is the best way to improve your odds of success. Risk management is crucial, pattern awareness is important, and position sizing is not something to ignore. However, it all begins with making a limited-risk entry, so timing is everything. Don’t rush the process.
Monitor the volume in relation to the price action. This stock made a few moves which, based on price alone, would have made me wonder. The trigger day saw a weak finish. Four days into the trade a bearish engulfing bar could have spooked me out. But neither were confirmed by volume. Instead, I kept seeing volume expansion along with advances in price, which gave me conviction in the trade and allowed me to stick with it.
Stick with good trades and don’t get shaken out. Along with the previous point on conviction, staying with a good trade can be tough. The price action or the overall market activity can cause premature evacuation. Stick with your trade plan and what the overall trade is doing. If it pulls back but volume’s weak, stay with your existing stop. It could just be a head fake on the way to much higher prices.
Hopefully this walk-through helps you understand better how I determine my timeframe for a trade. Beyond that, this review should also give you some insights into managing trades along the way, because learning to assess how a trade is developing is a critical skill you must possess for trading success.
If you want to know what I’m trading tomorrow, stop by the site and begin your trial to our stock pick service.
Trade Like a Bandit!
Jeff White
Producer of The Bandit Broadcast
MON Day Trade Review
June 10, 2011 at 10:13 am
Lately I’ve not trusted the price action much when it comes to swing trading, and that’s largely a product of how this market has been moving. Just a couple of weeks ago we saw a late-May ramp which produced trend line breaks for several of the indexes. However, that move was quickly erased, and the market continues to correct as I type.
The sharp rally and turn-on-a-dime reversal to the downside of the past couple weeks negated most bullish patterns which were building in the charts of individual stocks, and the nonstop selloff since then has taken with it anything which looked remotely bearish. Clearly, there just hasn’t been much in the way of high-quality bases and the kinds of clean patterns I really prefer to see when swing trading.
My preference is to swing trade for overall account growth, and day trade to create cash flow. Operating on multiple timeframes allows me to not only maximize the use of my capital, but also to benefit from directional moves which don’t even have to be correlated. I may be short on a swing basis to participate in a multi-day correction, but there will be intraday bounces along the way which are worth day trading. That kind of approach works best for me, and forces me to not only stay aware of current conditions but also to keep an open mind for what could happen next.
So with little available in the way of swing setups in recent days, I’ve focused on day trading. I wanted to walk you through one of yesterday’s trades (highlighted in Wednesday’s Broadcast) and show you how finding a setup on the daily chart and then managing it via the intraday chart can benefit you.
The Setup
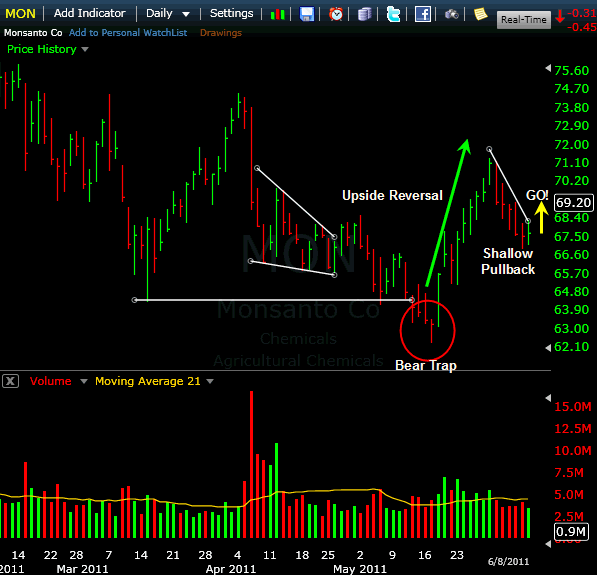
MON broke support in mid-May, but it proved to be a headfake and the stock turned sharply higher and tacked on a quick 10%. It pulled back early this month (along with the market), yet showed some nice relative strength by giving back only a portion of the previous move. There also was a clean descending trend line, which happened to be rather steep, marking the pace of the pullback. That offered a well-defined pivot for getting long, so I used $68.30 as my trigger for a long entry on Thursday. Here’s the setup:
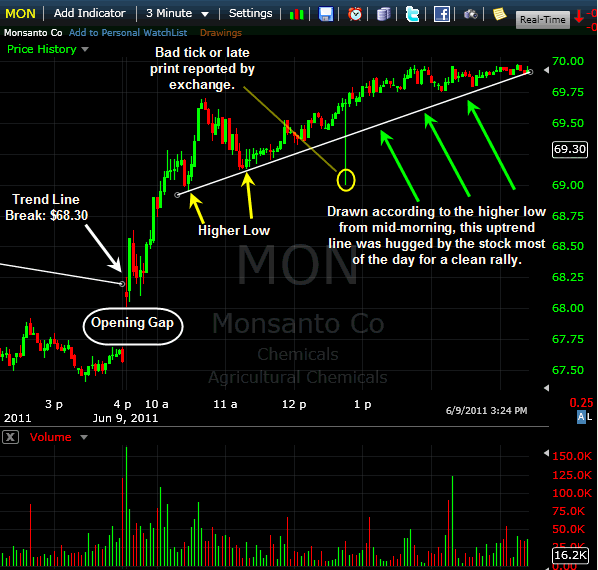
The stock cleared the trend line shortly after the open on Thursday, pushing past $68.30. About an hour later, it pulled back, but held above the prior intraday low (noted below). From there, it started to creep back up, allowing me to draw a very clean uptrend line which I then used as my get-out signal. Here’s the intraday chart:
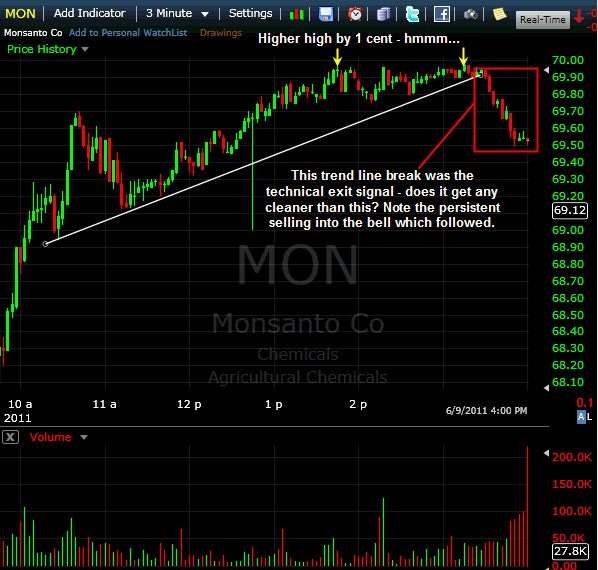
Late in the session, that uptrend line was broken to provide a technical exit and the stock slid lower into the closing bell as traders rushed to lock in profits. Here’s the chart showing the late-day break:
Takeaways from the Trade
Risk/Reward – As per my day trading strategy, my standard risk for day trades begins at 1% and is adjusted for volatility in the stock. This one required no special treatment, giving me an initial stop of 1%. As the stock trended higher in the opening hour, it made sense after a gap up open to expect that gap to hold, so I adjusted my stop to the low of the day (less than 0.5% –> even better!).
Intraday Trend – with the stock making regular higher lows intraday, it became clear that a change of that trend would warrant an exit. The emergence of a very clean uptrend line not only gave the stock a sustainable pace to rally, but also allowed for a well-defined, tight stop in case it were broken. I love finding setups on the daily chart and then trading them according to the intraday trend, and this is why.
Time of day – As the day progressed and the final hour arrived, MON made a new high by 1c as it cleared the previous high from 90 mins prior. Headfake. That break produced no follow through, which indicated that the high-level consolidation was in fact more of a battle than a rest. That alerted me to the idea of a failure at resistance, which happened soon after. The well-defined uptrend line was not far from price, so once it was broken it was clear that this was the time to ring the register and call it a trade (which traders did en masse). Grabbing a pain-free $1.60 or 2.3% isn’t bad for a few hours.
Trade Like a Bandit!
Jeff White
Producer of The Bandit Broadcast
Lighten and Tighten
June 6, 2011 at 11:38 am
An absolute commitment is required for some things in life, like let’s say, a social function. Either you’re going or you aren’t, right? However, other things might require a lower level of commitment. Your diet, for example, might currently be more of an “I’m trying not to eat too many sweets” approach right now. That’s what I’d call a partial commitment, where it’s not an all-or-nothing approach.
 When it comes to trading though, far too many traders think they have to be “all in” or “all out” of their positions. Nonsense! Think outside the box a little.
On the surface, we know that commissions are so cheap these days that there is no problem with splitting up positions by making partial exits when a situation calls for it, so that shouldn’t hold you back from adopting this mindset.
There are some occasions when it’s very useful for me to either lighten my position size, tighten my stop, or both. Let’s look at some examples of each, and I hope you’ll add your own thoughts to these in the comments below.
Lighten!
* I should clarify that I’m talking here about lightening up on a position mid-trade. This is not to be confused with when to trade smaller.
Lightening up on a position is a way to Defend both my capital and my profits. Whenever I get a poor fill on a trade where my order is executed at a price which is considerably different than my trading plan accounted for, it’s time to lighten up. By definition, the risk/reward profile of the trade has changed (since the entry price has changed and my stop is now farther away), so naturally I need to make an adjustment. This is the scale I use to do that on my swing trades. Doing this keeps my risk in check with what it should be, allowing me to stick with the trade – even if it’s now a smaller amount.
Tighten!
I won’t enter a trade unless I know my get-out (stop loss), but that doesn’t mean my stop never changes. Sometimes the situation changes in such a way that an adjustment is warranted.
 Market conditions may necessitate such an alteration to my plan. Suppose I’m long as a limo, and suddenly the complexion of the market shifts to something quite negative. Maybe news breaks or we see a key reversal set in – well, I’m in denial if I think the landscape hasn’t changed. In those cases, it makes sense to tighten my stops on long positions as a way to shore up my risk.
On a per-trade basis though, sometimes the way a stock moves just happens to change, and that can also warrant tightening my stop. Maybe a stock initially breaks out with momentum, but rather than showing follow through or putting in healthy rest, it simply begins to stagnate. Volume disappears, a sloppy trading range sets in, and I start to see a lack of conviction with weak closes in the stock for several straight days. That’s a time when I’ll definitely tighten up my stop, whether in time or price, as the stock simply isn’t behaving in such a way to deserve a long leash.
Both!
My favorite occasions are those which allow me to both lighten my position and tighten my stop. That usually occurs when my first profit target is hit. That’s a spot where the trade has moved enough to warrant booking some gains (lighten), but the stock may not be done running yet. Typically, I’ll have 2 targets, so sometimes there’s still room for additional gains.
At this point, my initial stop is also now a considerable distance away, so it makes sense to tighten it as well (often to breakeven for remaining shares). This way, I’m risking less on what’s left of my position, while still allowing for additional profits if the stock continues to run. Win/win.
** What are some keys you use mid-trade for knowing when to lighten up on your size or tighten your stop? I have a Bandit t-shirt for the best response, so bring the ideas!
Trade Like a Bandit!
Jeff White
Producer of The Bandit Broadcast


