MON Day Trade Review
Lately I’ve not trusted the price action much when it comes to swing trading, and that’s largely a product of how this market has been moving. Just a couple of weeks ago we saw a late-May ramp which produced trend line breaks for several of the indexes. However, that move was quickly erased, and the market continues to correct as I type.
The sharp rally and turn-on-a-dime reversal to the downside of the past couple weeks negated most bullish patterns which were building in the charts of individual stocks, and the nonstop selloff since then has taken with it anything which looked remotely bearish. Clearly, there just hasn’t been much in the way of high-quality bases and the kinds of clean patterns I really prefer to see when swing trading.
My preference is to swing trade for overall account growth, and day trade to create cash flow. Operating on multiple timeframes allows me to not only maximize the use of my capital, but also to benefit from directional moves which don’t even have to be correlated. I may be short on a swing basis to participate in a multi-day correction, but there will be intraday bounces along the way which are worth day trading. That kind of approach works best for me, and forces me to not only stay aware of current conditions but also to keep an open mind for what could happen next.
So with little available in the way of swing setups in recent days, I’ve focused on day trading. I wanted to walk you through one of yesterday’s trades (highlighted in Wednesday’s Broadcast) and show you how finding a setup on the daily chart and then managing it via the intraday chart can benefit you.
The Setup
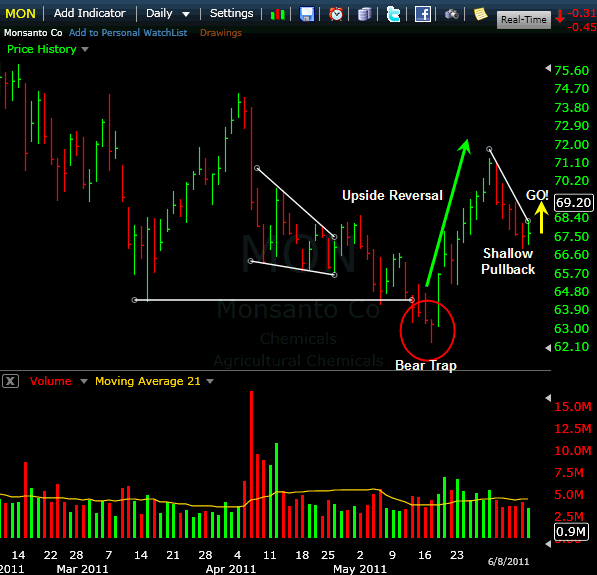
MON broke support in mid-May, but it proved to be a headfake and the stock turned sharply higher and tacked on a quick 10%. It pulled back early this month (along with the market), yet showed some nice relative strength by giving back only a portion of the previous move. There also was a clean descending trend line, which happened to be rather steep, marking the pace of the pullback. That offered a well-defined pivot for getting long, so I used $68.30 as my trigger for a long entry on Thursday. Here’s the setup:
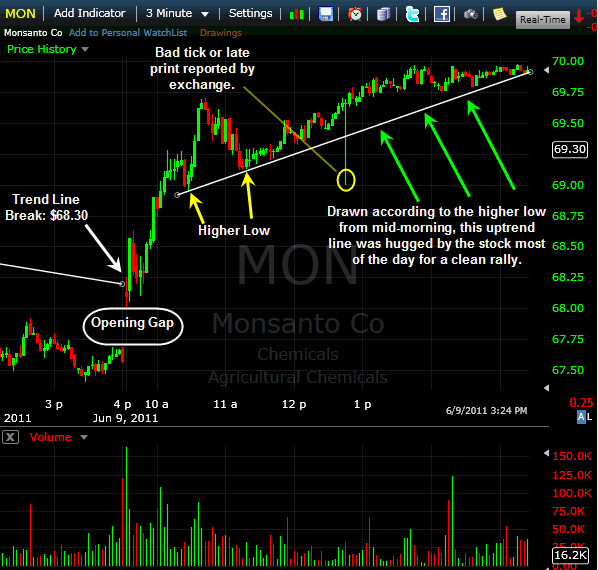
The stock cleared the trend line shortly after the open on Thursday, pushing past $68.30. About an hour later, it pulled back, but held above the prior intraday low (noted below). From there, it started to creep back up, allowing me to draw a very clean uptrend line which I then used as my get-out signal. Here’s the intraday chart:
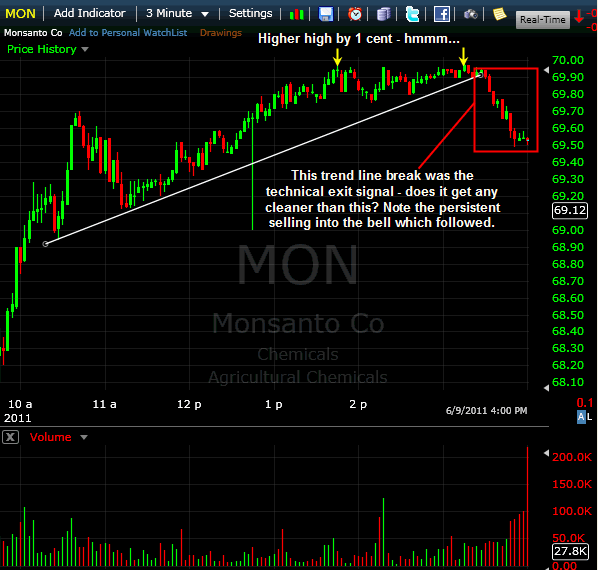
Late in the session, that uptrend line was broken to provide a technical exit and the stock slid lower into the closing bell as traders rushed to lock in profits. Here’s the chart showing the late-day break:
Takeaways from the Trade
Risk/Reward – As per my day trading strategy, my standard risk for day trades begins at 1% and is adjusted for volatility in the stock. This one required no special treatment, giving me an initial stop of 1%. As the stock trended higher in the opening hour, it made sense after a gap up open to expect that gap to hold, so I adjusted my stop to the low of the day (less than 0.5% –> even better!).
Intraday Trend – with the stock making regular higher lows intraday, it became clear that a change of that trend would warrant an exit. The emergence of a very clean uptrend line not only gave the stock a sustainable pace to rally, but also allowed for a well-defined, tight stop in case it were broken. I love finding setups on the daily chart and then trading them according to the intraday trend, and this is why.
Time of day – As the day progressed and the final hour arrived, MON made a new high by 1c as it cleared the previous high from 90 mins prior. Headfake. That break produced no follow through, which indicated that the high-level consolidation was in fact more of a battle than a rest. That alerted me to the idea of a failure at resistance, which happened soon after. The well-defined uptrend line was not far from price, so once it was broken it was clear that this was the time to ring the register and call it a trade (which traders did en masse). Grabbing a pain-free $1.60 or 2.3% isn’t bad for a few hours.
Trade Like a Bandit!
Jeff White
Producer of The Bandit Broadcast


Rean | Jun 11, 2011 | Reply
That was great Jeff, you always find a way to make it look really simple.. But one question regarding the ‘bad tick’ on your intraday chart, what causes it? and since it broke the trendline what made you decide to still stay long despite that break?
TheStockBandit | Jun 11, 2011 | Reply
Hey Rean,
Thanks for stopping by and for your question. A bad tick or bad print just means the exchange reported someone’s execution late. This gives the time and sales an out-of-sequence print, so it would look something like 69.67, 69.67, 69.00, 69.67 all in just a second or two. It’s not as if the bid or ask ever got close to that price (69) at that moment, so it’s a previous execution which is just getting reported late.
As for staying in the trade, I was eyeing the trend line and the bad tick didn’t warrant a legitimate exit.
Hope this helps to clarify!
Bill Jones | Jun 15, 2011 | Reply
Hi Jeff
Just came across your site whilst reading up on Don Worden. I have being using Telecharts for some years now so it is great to find your site using their charts. I like your comments and style and I will have a good read of your articles over the next few days.
Regards
Bill
TheStockBandit | Jun 16, 2011 | Reply
Hi Bill,
Appreciate the comments and I’m glad you stopped by, hope to hear from you often!
Jeff