 All Entries in the "Tools of the Trade" Category
Worden SnapSheets – A Look at the Future
July 12, 2006 at 10:32 am
Back in early February of this year, I was fortunate enough to be invited to be part of a focus group for a brand new product Worden is about to roll out – SnapSheets. There were about two dozen of us there and we were the very first ones to get to see this incredible technology which has been under development for the last few years. I had no problem signing a confidentiality agreement in exchange for a shot at getting a Beta version of SnapSheets installed on my laptop. Although it’s been difficult, I did remain silent until now (I finally got permission!).
Originally called Blocks, SnapSheets integrates seamlessly with the new TeleChart 2007. SnapSheets is free for TeleChart users and gives you data analysis capabilities that exceed what you will find in professional platforms costing thousands. SnapSheets is going to revolutionize the way stock chartists and researchers tinker with data, because it allows the user to combine data sources all in one place – on the code level.
SnapSheets can be run as an add-on/companion product to TC2007 or you can run it standalone. Here are some of the types of things you can do with SnapSheets & TC2007:
– Create your own custom market indexes & indicators for any WatchList
– Tie your active symbol to Internet browsers as you “spacebar” through your charts
– Access many new tools including point & figure, swing charts, million-dollar bar, monthly cycles, tables & much more
– Create your own conditional “true markers” on your charts
– Count any condition historically with ridiculous speed
– Plot an indicator of any indicator – there’s no limit to daisy-chaining or mixing of data
– Display the distribution of stocks in a WatchList using pie charts
– Plot technical indicators of TeleChart’s fundamental criteria (requires optional historical data feed)
– Write your own indicators (1000 times more powerful than PCF’s)
– Save custom-layout SnapSheets of any number of charts, tables and tools
– Use data from any source and display it in any way you want, with “on the fly” calculations of anything you wish to create
Like I said, the possibilities are truly limitless and this product is going to be the solution to the needs of so many traders. Developers can even create their own “Blocks” using any .NET programming language.
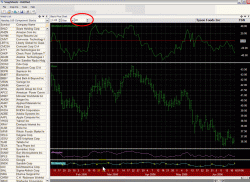
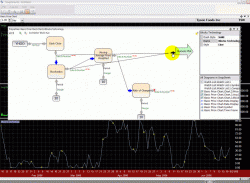
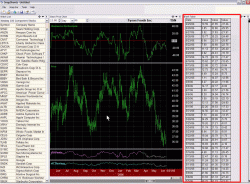
Here are a few screenshots of TeleChart 2007 & SnapSheets:
 SnapSheets allows you to add a ‘spinner’ to your charts for any indicator you want to change with just the click of an arrow or by entering a value. Want your moving average to be a 100-period average instead of a 9-period average? Use the spinner and it is instantly changed.
 SnapSheets can be changed right on the code level, and these “Blocks” can be pointed to send or receive data to any other source, making this the most versatile product available.
During the meeting I attended in Ft. Lauderdale back in February, Worden President Chris Worden and a few of Worden’s top programmers walked us through some examples of what SnapSheets is capable of and ways we could use it. We would suggest a bizzare calculation we wanted to see run on something like the component WatchList of the Russell 2000, like how many stocks were above their 50-day moving average back on July 12th of 1998, and the program could instantly display the results in any form. Think about that – a calculation on a couple of thousands of stocks over the course of numerous years done INSTANTLY! Even more amazing, this was calculated for all historical dates, so we could scroll through time and instantly see the calculation for any given date. Absolutely incredible!
Worden will soon be rolling out TeleChart 2007 with the SnapSheets installation, so if you’re a subscriber be on the lookout for it. If you aren’t a subscriber, click the banner below!
Jeff White
President, The Stock Bandit, Inc.
www.TheStockBandit.com
[tags]Worden SnapSheets, Worden Blocks, TeleChart, TeleChart 2007, Stock Chart[/tags]
How I Use Worden’s TeleChart 2007
July 11, 2006 at 10:33 am
I just reviewed Worden’s TeleChart in my previous post, which happens to be my very favorite in the “Tools of the Trade” category. With this post, I’ll go into more detail about how I actually use TeleChart 2007 from day to day and the features which are a part of my daily process. (I might add that this post is way overdue, as I regularly get asked about what charting program I use and exactly what I do with it. Sorry if you’ve been waiting for this one!)
TeleChart 2007 is my primary charting program, and actually the only one I use besides the one in my CyberTrader Pro trading platform. When I’m not entering orders or monitoring positions, you can find me flipping through countless charts on Worden’s TeleChart. This new version is unbelievabe, particularly with Worden’s new SnapSheets software – it can literally do any calculation on the fly that you can possibly program! (More on SnapSheets in my next post).
Worden’s TeleChart and TCNet
July 10, 2006 at 8:47 am
I’m a huge fan of Worden’s charting software, and I’ve been a user of it for 8 years. During that time, Worden’s product line has expanded and they’ve continually improved the product I started out with, TeleChart. I’ve tried products from other vendors and just haven’t found them to be any easier to use, more affordable, or better than what Worden offers. Worden strives to improve their software and service at all times, which is something I can definitely relate to! Worden also has something on the way which has the ability to do just about anything you’d ever want it to do – I know because I’ve been using it for several months. Needless to say, I’m not going anywhere!
So let’s take a look at some of the features of Worden’s charting program.
Worden’s basic charting package is called TeleChart 2005 or TeleChart Gold. It is $29/month and offers 20-minute delayed data, which is ideal for the end-of-day user or those who are swing trading based on daily charts. It comes with a host of canned features, such as:
– Entire stock market on your PC. You will literally have the entire market on your PC, with the ability to see every stock traded on the major US exchanges (bulletin board stocks or penny stocks not included). Every index is included too.
– Sectors. Seeing a stock on the move leaves traders like me looking for others in the same group which will move in sympathy. TeleChart allows you to see what sector a stock is in and then view all other stocks in the same industry or sub-industry.
– Component Watchlists. Ever wonder if a certain stock is in the Dow or S&P or NAZ 100? TeleChart keeps a current list of all stocks in these major indexes as well as many others, so the next time you’re wondering if that small-cap favorite is in the Russell 1000 Index, you’ll quickly be able to find out.
– Sorting. TeleChart allows you to sort by almost any criteria you can think of, right ‘out of the box.’ This is such a valuable feature, and the ability to sort a huge list of stocks with the click of a mouse is a tremendous time-saver. Among the limitless sorts are Volume, Beta, Capitalization, Float, Symbol, etc. The list goes on and on and you can even create your own.
TeleChart offers a host of charting possibilities as well:
Chart Templates. You can have unlimited chart templates, which are kind of like pages of charts which each have their own properties. Say you look at moving averages for trending stocks but you don’t want to see them otherwise – you could set up a chart template and with the push of one button instantly have those moving averages displayed. Maybe you sometimes look at candlesticks and other times you look at bar charts. Set up a different template and you can have them both anytime you want them.
Chart Customization. You can set up your charts to look however you want them. Make the bars or background whatever color you want. Add or remove gridlines. Add indicators (and custom indicators) to the chart window or down below, colored however you want them. Resize the charting area or indicator panes, or put indicators in panes above the prices.
Indicators. TeleChart comes pre-installed with just about any indicator you can think of. Whether you want moving averages, stochastics, Bollinger Bands, or almost anything else, it’s right there waiting for you to use it. You can even create and use your own.
EasyScans. EasyScans are appropriately named, as they’re a cinch to set up and they allow you to scan the entire market instantly for whatever you want. Let’s say you want to create a new watch list looking for all Nasdaq stocks which are above $5.00 but below $25.00 and have an average daily volume of 100,000 shares or greater. An EasyScan will let you do that and it will take you just a couple of clicks and you’ll have that list in seconds. Even better, once you have the list, you’ll be able to sort it by whatever criteria you want. It’s really amazing.
PCF’s. Personal Criteria Formula’s (PCF’s) are formulas which you write that add a new sort and scan criterion to the program. This is an advanced feature but a formula wizard can walk you through creating PCF’s. An example PCF would be if you wanted to be able to sort your stocks by something like “Price Percent Change last 50 Days.” This advanced feature has unlimited possibilities, which makes it a valuable function to many users.
TCNet. TCNet is the real-time version of TeleChart, also called TeleChart Platinum. TCNet is $99/month and provides real-time streaming charts, news, and live chat with other TCNet users. TCNet also offers alerts, which are an excellent feature if your trading platform doesn’t offer them. The alerts can be set for stocks you’re monitoring, and it can notify you via pop-up, email, or pager. The alerts are real-time, which is great in a fast-moving market compared to other providers of free alerts which are on a 20-minute delay.
Whether you go with Gold or Platinum, you’ll have the exact same charting program with either one, the main difference is real-time vs. delayed data. If your trading platform has a real-time data feed and you do your intraday charting with it, then the delayed TeleChart Gold should serve you well. However, if you want to be able to do all of your charting in one place and you want the alerts, news (including Briefing.com’s InPlay), live chat, and the ability to share your charts with other users, then TeleChart Platinum or TCNet is the one for you. It’s an amazing product and I won’t trade without it – I haven’t for 8 years now.
Take a free 30-day trial of TeleChart and check out what all it has to offer. I’m betting you won’t find anything that offers you an easy way to perform so many functions, especially at the price.
(By the way, Worden has a ton of help/tutorial videos on their site which will walk you through how to do virtually anything. Once you’re there, click the “Training” link at the top of the page.)
Jeff White
President, The Stock Bandit, Inc.
www.TheStockBandit.com
[tags]Trading Software, Stock Trading, Stock Market, Stock Chart[/tags]
StockTickr Trading Journal
May 24, 2006 at 10:35 am
Good money management can mean all the difference in the world when it comes to your trading results.
I’m a big proponent of keeping tabs on trading results periodically so that you can know where to make adjustments in your game plan. It’s common knowledge to back down trading size during poor performance and ramp it up when trading well, but let’s go a step further.
Enter: Expectancy. Recently I did a post about position sizing, but it goes hand in hand with the topic of Expectancy. Simply stated, Expectancy is what you can expect to make (on average) per dollar risked. Mathematically it is calculated with the following equation:
Expectancy = (Winning Probability x Avg. Win) – (Losing Probability x Avg. Loss)
Although this formula isn’t difficult to calculate, there is a simpler way – let technology do it for you! StockTickr Pro offers a “Journal” which not only calculates your Expectancy, but also the factors which go into the equation above. If you’ve ever wondered what your win/loss rate is or what your average winning trade is, the Journal in StockTickr Pro will tell you. A trading tool like this will make it far easier and faster at the end of the week or month when you’re reviewing your trades to see what mistakes and weaknesses need working on so that you can correct them and avoid trading mistakes which are costing you.
The StockTickr Journal also includes some very cool and useful features such as dynamic position sizing and a great summary page where you can measure your progress over time in terms of your risk.
CyberTrader Client Summit
May 12, 2006 at 7:34 pm
I just wanted to send a big THANKS to the great folks at CyberTrader for inviting me to participate in the first-ever CyberTrader Client Summit recently. It was a great time of interaction with a handful of other traders as well as a wonderful opportunity to get the full tour of the CyberTrader facility and a behind-the-scenes look at their entire operation. I’ve never seen so many safety nets in place for staffing, data, order routing venues, and so much more. They’ve really thought of everything, and they even test their backup plans regularly!
Simply the fact that CyberTrader was interested in inviting a handful of traders in for feedback reinforces to me that they care about the ongoing improvement of their product and services. I’ve seen this over the past few years in the enhancements they’ve added to the platform, but last week was confirmation of that. Because trading is my job and I’m a CyberTrader client, I was quite delighted to be reminded of just how important client feedback is to them.
WSJ Online Quote
May 8, 2006 at 10:48 pm
I sure appreciate The Wall Street Journal Online quoting me in tonight’s article, What to Expect From Another Decade Of Investing Online.
I believe strongly that the internet will continue to evolve somewhat, but that the biggest change we’ll see moving forward as it relates to trading will be the way we use it, most notably via wireless trading. It’s already common to have wireless access for a laptop computer, and I’ve had the ability to trade wirelessly via my PalmOne Treo for a couple of years now through CyberTrader. I think that kind of technology will become more widespread and improve by leaps and bounds in the next decade, and it could very well impact how trading is done around the globe.
Exciting stuff! I can’t wait to see how it evolves.

By the way, The Wall Street Journal Online still has a few days left for their Open House as they celebrate 10 years of being online. Congratulations to them as they continue to put forth only the highest-quality content!
Jeff White
President, The Stock Bandit, Inc.
www.TheStockBandit.com
CyberTrader Pro
April 25, 2006 at 6:31 pm
Bar none, it is the most important thing when it actually comes down to placing and monitoring your trades – the trading platform.
Trading is my job, and I want to be using the best tools available for my specific needs. Having said that, I’ve tried out plenty of trading platforms along the way, and the platform of choice for me is CyberTrader Pro. I’m asked frequently which broker I trade through. Here are a few reasons why I am with CyberTrader:


