 All Entries Tagged With: "Chart Reviews"
CVX Bull Flag Offers Potential
November 10, 2009 at 9:44 am
My nightly routine includes locating setups for tomorrow’s trading session, but I don’t want to stop there. Taking it one step further, I want to be aware of any other stocks which may be gearing up for moves in the days ahead – radar stocks, if you will.
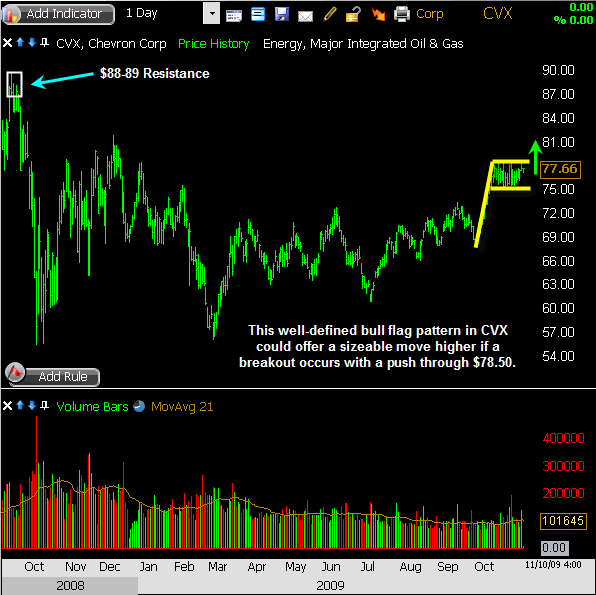
One setup that’s been on my radar for the past few days is CVX. The stock has trended steadily higher from the July low, and more sharply from the October low. Since then, it has settled into a very well-defined trading range over the past 3 1/2 weeks. The rally-and-base combination has built a very clean bull flag pattern, which offers not only a technical entry on a breakout but also an exit if that pattern should happen to fail.
I have no position here yet, but if this one clears $78.50 to break out from the bull flag, I’ll get real interested real fast.
A measured move could take this one on up to the $88-89 area, which would coincide with a resistance zone from August and September of 2008.
Here’s a closer look:
Trade Like a Bandit!
Jeff White
Are you following me on Twitter yet?
Oversold Bounce or Higher Low?
October 29, 2009 at 9:51 pm
Following an impressive surge higher from early October, the market has finally taken a breather. The pullback of the past week has offered at least a short-term change of character that has my attention – and yours as well, I’m sure.
Downside follow through has been notably absent for some time now…until this week. Four consecutive declines began with last Friday’s reversal from the highs in the NAZ (2190), and ended with Wednesday’s punishing selloff. Thursday’s bounce was headlined by a near-200-point jump on the DJIA, but under the surface we saw the NAZ post an inside day. The S&P 500 erased Wednesday’s losses, but on declining volume. Mixed signals, to say the least.
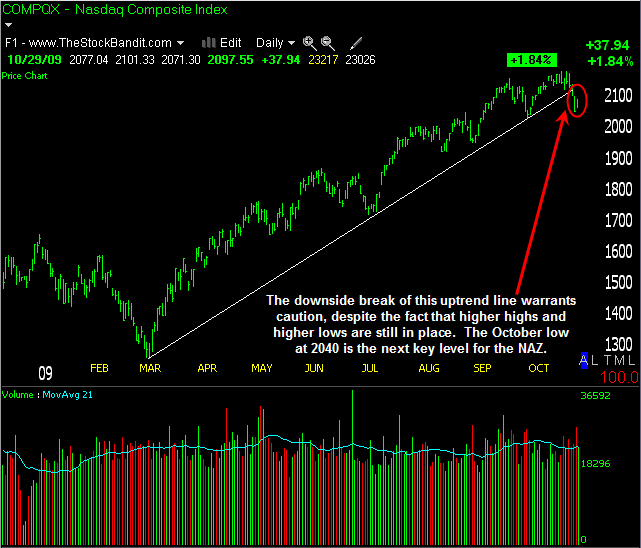
Looking at the daily charts of the indexes, a case can be made for more than one scenario here. We are in well-defined uptrends, and the dip of the past week could again get bought and prove to be yet another higher relative low within the trend. But by the same token, the bounce we saw on Thursday could merely prove to be a relief rally after the harsh selling which put the market short-term oversold. It’s hard to place my entire weight on either scenario just yet, as more technical evidence needs to be seen to support one or the other.
So at this point, I’m making zero predictions. This isn’t a spot to buy blindly and bank on another rally straight back up to new highs. The selling intensity we just saw wasn’t like the modest pullbacks which preceded it. It was a little more vicious and a little more ominous. It could be the start of a change of character. And this isn’t a time to call for a market top and start shorting the daylights out of every name out there. The intermediate trend is still up, and that should be respected.
I’m expecting the next few days to carry some significance. Either the bulls prove themselves yet again, or the bears build on their newfound confidence and we see another leg down begin to develop. Personally, I don’t care which side wins out – I have no bias.
My approach is to stay very short-term for the next couple of sessions, day trading for quick moves in this increased volatility, and see what happens. Many stocks broke down hard and have the potential to construct bear flags and rising wedges if the rebound loses momentum and volume continues to sag. I’ll be watching those bounces intently. Other stocks still aren’t far from their highs, so I’ll observe them closely for signs of real strength returning – not simply a relief bounce of one day.
Both the bulls and bears have something to prove these next few sessions, so it could wind up being a pretty good battle. No matter what, volatility is picking up, and that’s a great thing for us as traders.
So stay objective out there, anything is possible. Expect surprises in both directions. We’re getting into the best season for trading in the next several months, and I’m excited about it!
Trade Like a Bandit!
Jeff White
Are you following me on Twitter yet?
Bearish Engulfing Bars Warrant Caution
October 21, 2009 at 9:35 pm
Following gains of more than 7% in just a dozen days, today we saw the market averages tag new recovery highs and then reverse sharply to finish in the red. The bearish engulfing bars which resulted on the daily charts aren’t pretty, especially given the elevated volume which accompanied them.
It hints that this market is finally showing us a little fatigue, and that perhaps more than a few buyers morphed into sellers – at least for today.
If we did see a pullback begin to develop here, it wouldn’t at all be an unhealthy thing. Several dips have occurred since the March lows were set, with each of them being bought. Now, at some point that is going to change – it’s imperative to understand that – but we don’t yet have enough technical evidence to jump to conclusions at this point for anything but the next few days. And on that note, caution is warranted after today’s action.
Just a little while ago over on the trading videos site, I posted the following video. In it, I discuss what took place today, and offer up a few levels on the downside we could see tested if Wednesday’s selling pressure sees follow through.
Let me highly suggest clicking the “HD” on the video player and then going full-screen for best quality.
Thanks for stopping by and I’ll see you here soon with more. Until then…
Trade Like a Bandit!
Jeff White
Are you following me on Twitter yet?
Why I’m Not Trading AAPL
October 19, 2009 at 10:27 am
AAPL is set to report earnings after today’s closing bell. It’ll be the focus of attention at times both today and tomorrow as the dust settles post-news, but truth be told, I have no interest either way.
Obviously it’s one of my trading rules to avoid stocks when they’re reporting earnings, as scheduled fundamental news simply carries with it no edge for me as a technical trader.
But I’ve had no interest in trading AAPL for a few months now. Let me explain why.
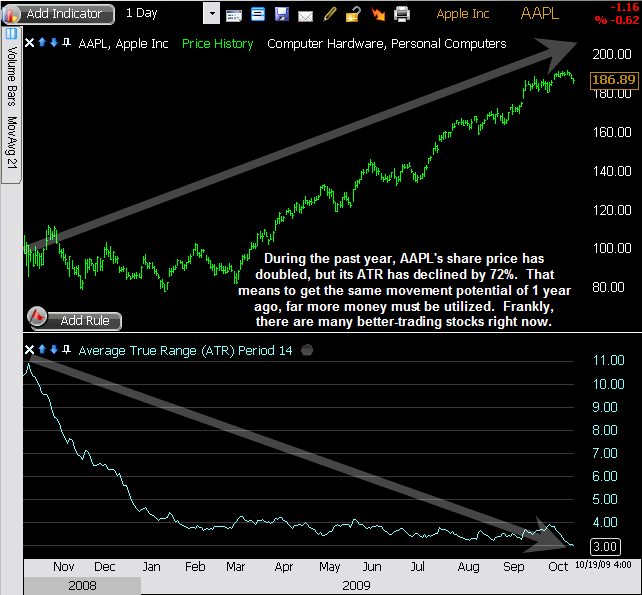
The short answer is that AAPL simply doesn’t move enough. For a stock that’s highly liquid (over 15 million shares/day on average) and within sneezing distance of $200, it should move a lot. And yet it doesn’t. On an average day, it’ll see an Average True Range (ATR) of about $3. There are stocks trading at a fraction of AAPL’s price which move that much and are still highly liquid, so why pay up for less movement?
Let’s take a look at the chart.
Over the past year, we’ve seen AAPL’s price rise dramatically, while its movement has shrunken dramatically. ATR is a price-based measurement (not percent), so as price gets higher and higher, often times we’ll see ATR expand along with that. That’s not the case with this stock.
StockFinder Chart courtesy of Worden
Anytime you’re trading the high-priced stocks, do your best to gauge whether there’s enough movement there on an average day to justify an entry. Others like GOOG, CME, and BIDU all are higher-priced than AAPL, but on a relative basis (when comparing ATR) they each move considerably more than AAPL.
At some point, AAPL will be worth trading again, but on an average day right now, the moves are just too limited to warrant an entry.
Thanks for stopping by and I’ll see you here soon with more. Until then…
Trade Like a Bandit!
Jeff White
Are you following me on Twitter yet?
Understanding the Quiet Rally
September 23, 2009 at 8:32 am
It’s been one impressive rally…by some measures. The indexes have made an about-face from the March lows, refusing to look back as they erase so much of the carnage of the bear market. The move has been persistent and consistent…just a ton of green days.
But very few big days. Have you noticed?
I’ve been amazed at the lack of volatility, especially recently. It seems a huge day for the DJIA has become a triple-digit net change from the prior day’s closing levels. Just a few months ago, we were getting gaps that big to start the day, nevermind the several-hundred-point moves which were commonplace. Needless to say, it has indeed become a quiet rally.
In order to understand it a bit better though, I turned to an indicator to help make sense of it all, and I was surprised at what I found.
Different Directions
In the video below, I’ll walk you through my thought process that led me to doing this, and of course I’ll explain what it is that I discovered. Of equal importance, you’ll understand how and why navigating this market for as long as this rally runs its course will require a different approach than what is ‘typical’ (if there is such a thing in the market).
Here’s a video explaining it. Select the HD option and go full-screen for best quality:
Thanks for stopping by and I’ll see you here soon with more. Until then…
Trade Like a Bandit!
Jeff White
Are you following me on Twitter yet?
Implementing the Time Stop
September 15, 2009 at 10:03 am
Staying patient with a position can sometimes pay off nicely. After all, not every trade works out exactly when we want it to. It might require a little more time than we originally expected before we see that P&L turn the shade of green we were looking for, and it’s sure nice when that happens.
But there is a flip side to the coin.
Sometimes you can be overly patient with a trade, giving it more and more time (dare I say too much?), just waiting for it to make its move. And I’m not referring to letting it move farther and farther against you – you know better than that!
I’m talking about the trade that simply goes nowhere.
Fortunately, there is a solution to the flatlining trade, which is to implement a time-based stop. This is essentially a countdown placed on the trade, that if nothing happens by a certain time, then either an adjustment is made to stop & target levels, or the trade is simply closed out. You know – so you can move on with your life!
After all, why tie up capital in a position which isn’t performing as expected? Kicking a stagnant trade to the curb can translate into more money to be put toward another opportunity, plus it enables us as traders to put our attention toward something more worthwhile.
Show Me the Money!
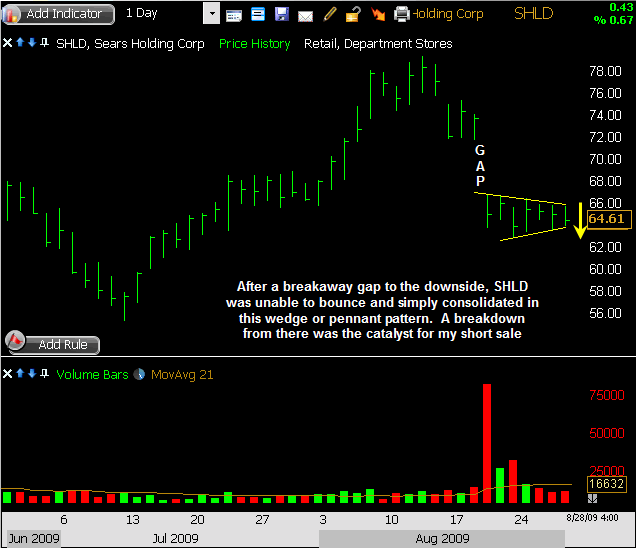
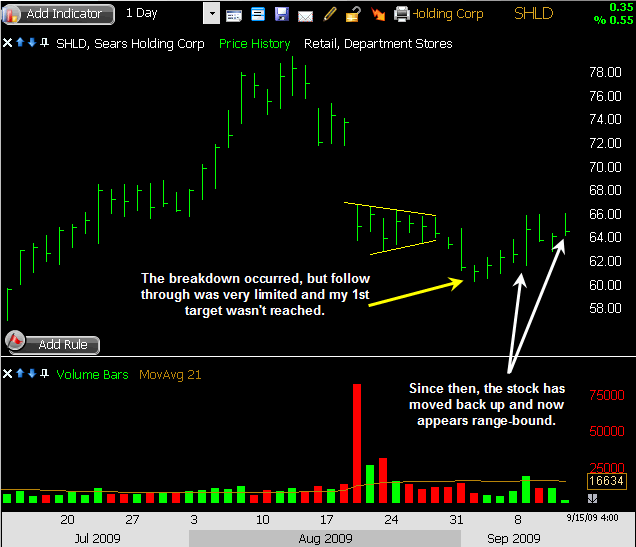
Just this week I faced this dilemma. I was swing trading SHLD on the short side due to the breakdown from a bear pennant pattern (see chart 1 below), but aside from the initial weakness, there was no follow through (see chart 2 below).
I had designated 2 targets for my exit, and of course 1 stop loss in case the stock reversed and went back above resistance, but none of those levels were reached. The stock refused to go down far enough for me to start booking profits (according to my trading plan), and yet it wasn’t bouncing enough to stop me out either.
Chart 1:
 StockFinder Chart courtesy of Worden
Chart 2:
 StockFinder Chart courtesy of Worden
Although SHLD was certainly underperforming the market, and I felt confident if market weakness ever arrived that SHLD would crack pretty good, that never happened. The stock simply formed a trading range, and I began to realize it was essentially a stagnant trade.
Time to Move On
Over the weekend, I decided I’d give the stock through Monday before making any moves, and so when it remained in its range, I tightened my stop heading into Tuesday, and today as the stock reached my adjusted stop I closed the position for a minor loss.
I know what some of you are thinking… Why give up on what might eventually develop into a good trade?
Don’t think of this as surrendering or giving up on a trade, because I know that can be difficult for traders who don’t mind being patient. Rather, consider it your responsibility as a trader to keep your capital working for you in the best manner possible.
That means putting it at risk when there’s a good possibility of profiting, and it means protecting it from risk when that potential isn’t present.
The longer we’re in a position as traders, the more we become exposed to company-specific, unplanned news…a surprise, if you will. Leaving a position at risk indefinitely raises the likelihood that news will eventually push the trade one way or the other. The problem with that is that a trade initiated from a technical standpoint should not evolve into a trade which is hopeful for news to make it move. We want real selling or buying to be the deciding factor, and when that turns stagnant then the basis for the trade is negated.
So as you work through your position sheets this week, consider whether some of those stocks are merely resting or if instead they’ve completely lost momentum and are now simply range-bound.
Do your best to determine if a little more patience is needed, or if instead a little less patience is warranted. Time is money, especially for a trader. It might be time to put that trade on the clock and set a deadline. A far better trade just might be waiting for you.
Thanks for stopping by and I’ll see you here soon with more. Until then…
Trade Like a Bandit!
Jeff White
Are you following me on Twitter yet?
Stack the Odds for Daytrading Success
September 3, 2009 at 5:04 pm
Trading is all about stacking the odds for success. Risks must be taken in order to get paid, but the key is gauging under which circumstances the potential reward really outweighs that risk.
I discussed taking risks in a recent post, and I felt that a follow-up and an example of what I was referring to was in order. Here it is.
Many of my trades are continuation plays. They can be great for offering situations which warrant putting some money on the line once clues of a continued move are present.
However, there are many opportunities on the intraday timeframe which are exhaustion/reversal kinds of setups.
Buy or sell programs, news, and just plain old momentum drive stocks far beyond the pain thresholds of traders, carrying price a considerable distance in one direction or the other. That opens the door for some recoil, and catching the turning point can be quite lucrative.
Stacking The Odds
Here in a moment, I’m going to show you exactly what I mean in a video, but first let me outline a few keys which combined to produce a great trade in this situation.
- Corresponding market action. With the indexes having a distinct possibility of a short-term turnaround, conditions were ripe for similar price action in individual stocks. This is a point I make over and over in the weekly index videos.
- Prior key level on the daily chart of this stock was being tested. A huge intraday move which carries price right to a previously important level on the daily chart will increase the odds for a quick recoil move.
- Intraday price action suggested the move was becoming exhausted. That indicated that a reversal could quickly develop in the stock.
Here’s a video explaining it. Select the HD option and go full-screen for best quality:
Stack multiple factors in your favor for a great trading situation. They’re worth waiting for!
Trade Like a Bandit!
Jeff White
Producer of The Bandit Broadcast


