 All Entries Tagged With: "Chart Reviews"
4 High-Level Breakout Candidates
September 4, 2012 at 10:37 am
With the indexes sitting not far from 52-week highs, a number of individual names are also pressuring longer-term resistance zones. I wanted to share a few breakout candidates I’m watching which belong on the radar in the days and weeks ahead.
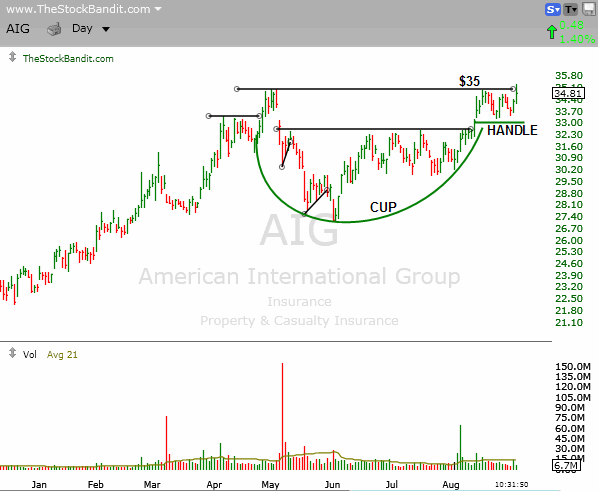
AIG is acting well with a high Cup and Handle pattern, and is actually attempting a breakout today. A close above $35 is needed to confirm a breakout.
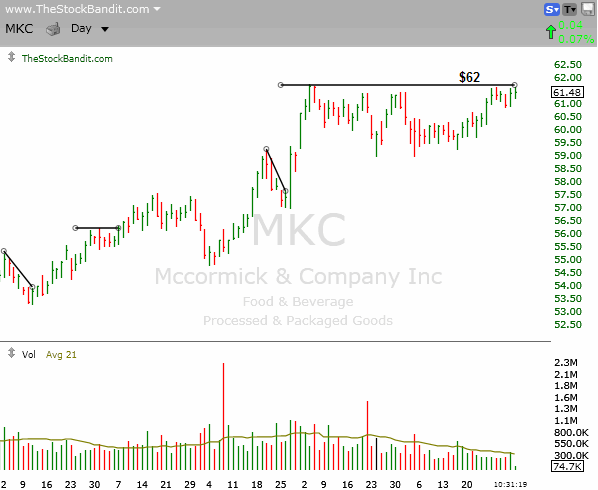
MKC has created a high-level base which almost resembles a saucer pattern. A push through $62 would constitute a solid breakout. This stock trades slightly lighter volume than the others.
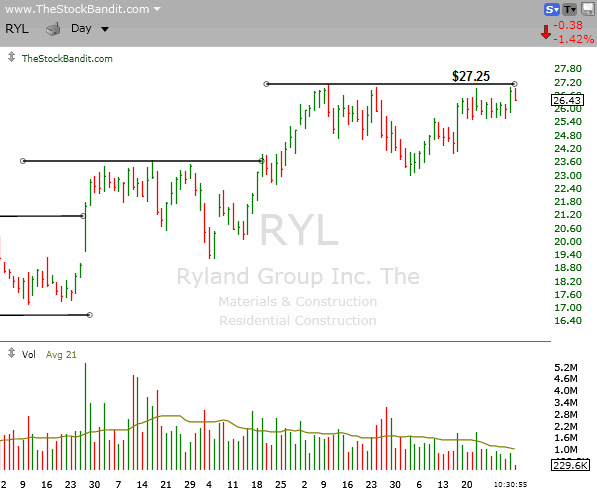
RYL continues to exhibit strength, and has spent a few weeks challenging resistance. A breakout takes place through $27.25.
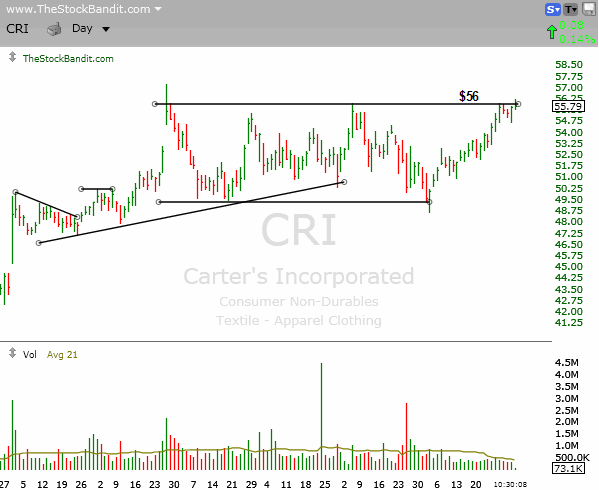
The $56 level has posed as multi-month resistance for CRI, and although the stock has pushed past it a few times intraday it has yet to close above it. That’s a well-defined level to keep an eye on which if cleared, would indicate an exit from this wide channel.
Trade Like a Bandit!
Jeff White
Subscribe to our Stock Pick Service to get our trades.
TRIP Ready to Stumble
August 31, 2012 at 3:09 pm
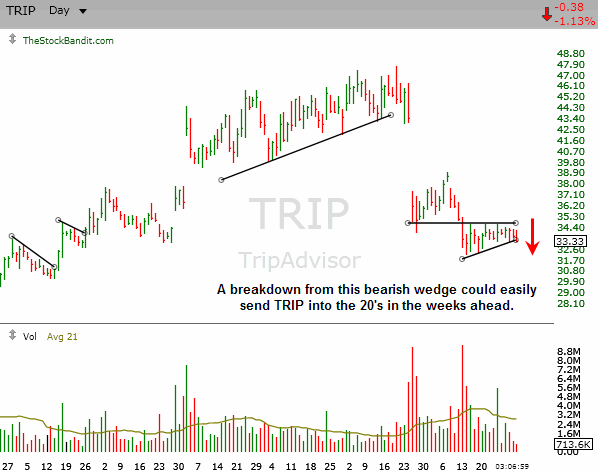
TRIP saw a big negative change of character in late July with a big downside gap on heavy volume. The initial recovery attempt fell right on its face with the creation of new correction lows just three weeks later, highlighting the importance of avoiding the long side after a trend shift.
Currently, the stock is wedging beneath former support after bounce attempts in the past two weeks have proven unable to reclaim the $34.75 area. The rebound is looking stalled-out, and now price is beginning to weaken. A break of the lower rising trend line of this wedge would occur around $33.10 to be sure, and would likely usher in lower prices in the coming weeks.
Here’s a closer look at the chart of TRIP for you:
Trade Like a Bandit!
Jeff White
Subscribe to our Stock Pick Service to get our trades.
Wait to Place Bets on LVS & WYNN
August 30, 2012 at 11:28 am
Casino stocks have seen a marked improvement in their price action over the past month. A couple of them looked like death, but alas, they have perked back up and shifted their path of least resistance.
Two names in particular are LVS and WYNN, both of which have seen very constructive price action in recent weeks with upside momentum as well as rest phases – a very bullish combination.
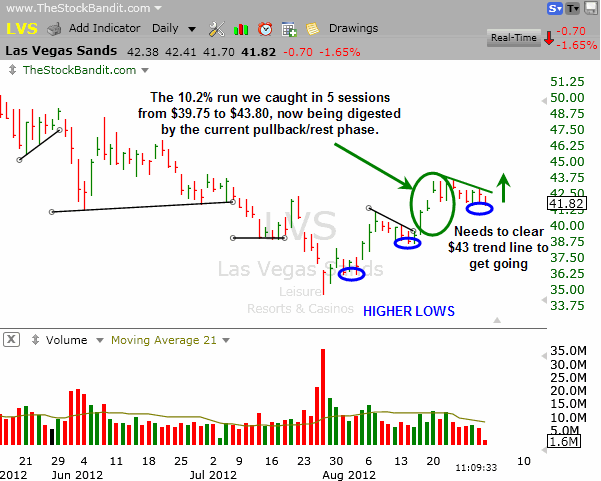
I caught an excellent swing trade in LVS (which I shared with members) on Aug. 16 as the stock pushed past a descending trend line at $39.75 to begin another leg higher. That was worth a quick $4.05 to us as just 5 sessions later it hit Target 2 at $43.80, proving to be a timely exit.
Since then, it has given up a couple of points with some mild profit taking, but remains overall bullish. The stock may need a bit more time before it’s ready to rise again, but it belongs on the radar. The next move may not be quite as smooth, but a longer-term trend change looks to be in the making with a considerable cushion in place between current prices and the July low.
Here’s a closer look at the chart of LVS for you and the levels to keep an eye on:
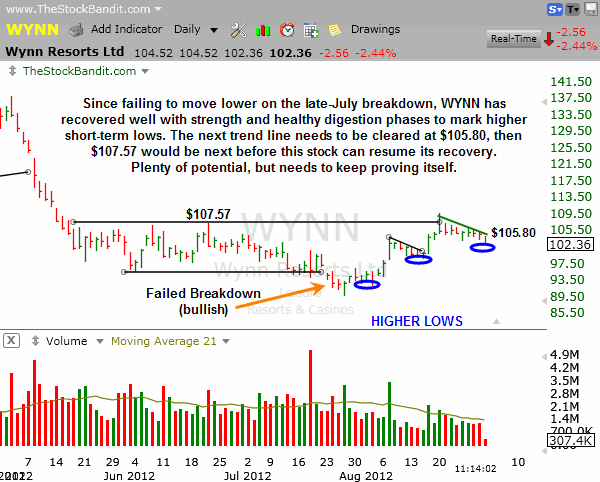
Another name in the same group is WYNN, which has seen a similar shift of character in recent weeks. Following a breakdown from the May-July trading range, the stock worked its way back into the range and early last week pushed past the upper boundary to create a higher high.
Since then, we’ve seen a quiet retreat but no negative character change as of yet. The current pullback could quite feasibly result in another short-term higher low (vs. $99.09 on 8/15), keeping the 4-week uptrend intact. Next it would need to close above the June high ($107.57) to confirm an exit from the channel, and then it’s got ample room to run higher to retrace the May selloff.
Here’s a closer look at the chart of WYNN for you and the levels to keep an eye on:
Each of these are showing signs of life again after harsh corrections from their spring highs, but may need a bit more time before they’re set to go. Keep them on the radar.
Trade Like a Bandit!
Jeff White
Subscribe to our Stock Pick Service to get our trades.
Under Armour Over Achieving
August 29, 2012 at 11:21 am
Relative strength is always applicable when comparing a stock with the overall market, or with its competitors.
In the case of UA, we’ve seen clear outperformance and plenty of relative strength compared to its senior rival, NKE. Since the beginning of the year, UA has tacked on 61%, while NKE has added a measly 2%.
Here’s a comparison chart of UA vs. NKE for 2012:
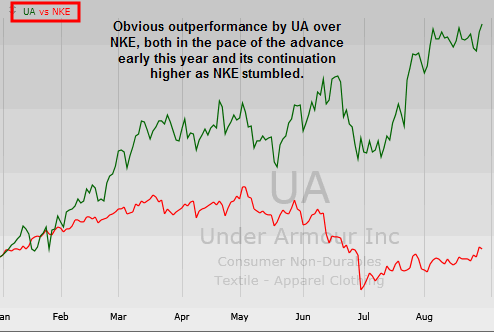
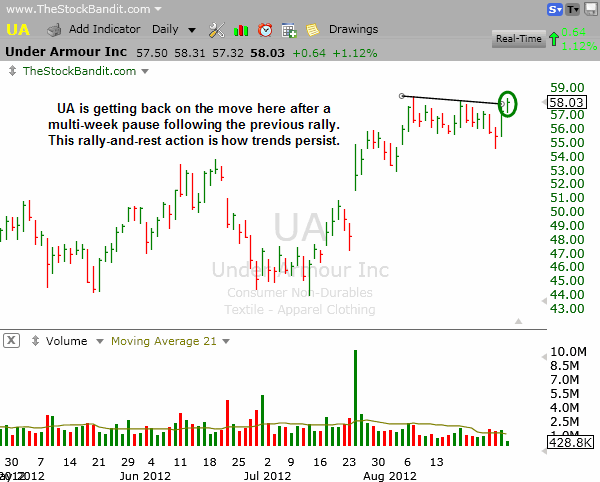
While UA has had an already impressive year, it has come with a few bumps in the road and the occasional swift pullback. However, overall the chart looks excellent on the year with an early rally, a mid-year trading range, and some continuation higher since late June. Today it’s clearing a short-term trend line from the past few weeks as it challenges the 52-week high. Needless to say, it looks poised to add to its YTD gains.
Here’s a closer look at the chart of UA for you:
Trade Like a Bandit!
Jeff White
Subscribe to our Stock Pick Service to get our trades.
Confirmed Trend Change for VZ
August 29, 2012 at 10:21 am
The double top pattern – like the double bottom pattern – is over-diagnosed. Anytime a stock challenges a previous high, the amateur technician jumps at the chance to declare a double top in the making. And generally they’re premature in doing so.
But the professional takes a different approach.
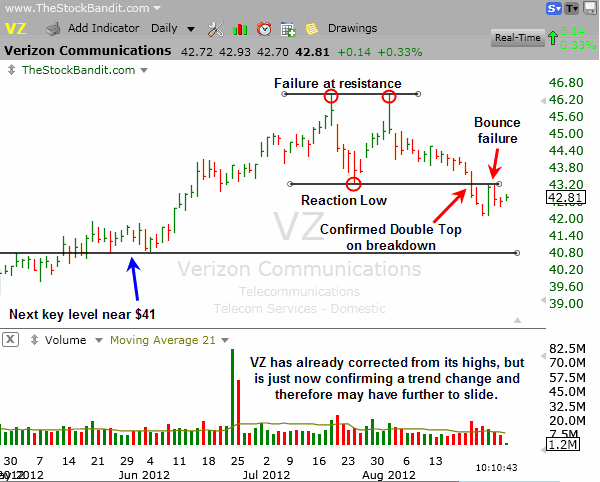
Rather than seeking to be the first to recognize a trend shift, it’s better to wait for confirmation of that change to come along. And in the case of the double top pattern, that requires a break of the reaction low or pullback low which was established between the peaks.
A stock fitting this description right now is VZ, which just confirmed not only a double top but has also offered an additional layer of importance by failing to reclaim former support on the bounce.
One other note is to take a look at the 2nd high on the chart on Aug 1. Price touched the previous high to the penny (not a requirement for a double top, by the way) and failed to clear it, but something else happened which was noteworthy: the finish for that day was much weaker than the day when it initially marked a high (July 18). This is another thing to watch for which might offer clues that a stock is perhaps running out of steam and deserves a closer look going forward in anticipation of a potential trend change.
Going forward for VZ, the path of least resistance is down, at least until the $43.40 area (lateral support/resistance) is reclaimed on a closing basis. That’s the level which can now be traded against. The stock looks to have next support around $41, which was a level of importance back in May.
Here’s a closer look at the chart of VZ for you:
Be careful jumping to conclusions about double tops or bottoms. Instead, be patient enough to wait for confirmation of a trend change so you can trade with greater confidence of the direction.
Trade Like a Bandit!
Jeff White
Subscribe to our Stock Pick Service to get our trades.
Denver Traders…
June 1, 2012 at 9:05 am
If you’re a Denver trader or are located in the surrounding area, make plans Friday June 8th or Saturday June 9th to see me present live in conjunction with Worden!
![]() On both Friday & Saturday (June. 8 & 9) at the Worden TC2000 workshop, I’ll be teaching live. It’s at the Denver Marriott West (1717 Denver West Boulevard, Golden, CO 80401). The workshop starts at 10am and ends at 4pm, and I’d love to see you there either day.
On both Friday & Saturday (June. 8 & 9) at the Worden TC2000 workshop, I’ll be teaching live. It’s at the Denver Marriott West (1717 Denver West Boulevard, Golden, CO 80401). The workshop starts at 10am and ends at 4pm, and I’d love to see you there either day.
Specifically, I’ll show you what’s been working best in the market lately, what looks best going forward (so you’ll leave with some actionable ideas), and we’ll build a watch list together of your stocks and read the charts together.
I have a lot of good stuff planned, plus you’ll see the new version 12 of TC2000. I’m excited about being there and giving you some insights for better trading. Make plans to be there by pre-registering or just show up (it’s free) – but get there early for a good seat!
Trade Like a Bandit!
Jeff White
Producer of The Bandit Broadcast
Get our free newsletter to keep up!
Follow @TheStockBandit
Wait for the Trend Line Break!
April 11, 2012 at 6:36 am
As a pattern-based trader, I use a lot of trend lines on my charts. When you look at my charts, the only indicator you’ll see is the 21-period MA of volume, which is the running 1-month volume average. Beyond that, it’s just price, volume, and trend lines around the patterns I see in price.
I keep it simple.
Confirmation of those patterns is what I require before taking entries on 99% of my trades, which means price crossing through a trend line. The way I view it, until that line in the sand is crossed, nothing has changed. The rest phase or pullback must not be done until then. I may detect price perking up or volume percolating, but until the trend line breaks, the setup cannot be fully embraced as a positive change of character.
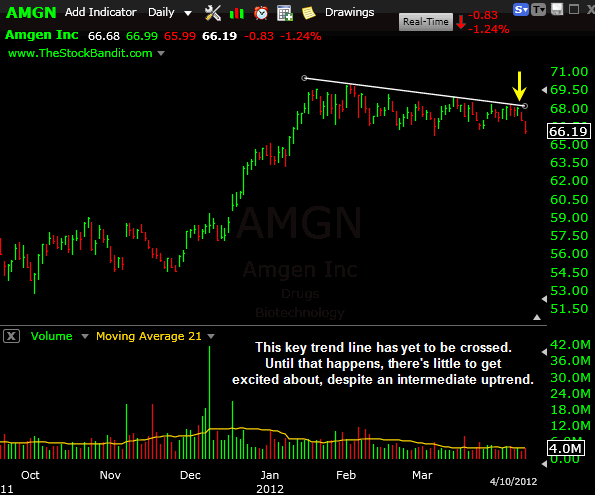
Right now there’s an excellent example in the chart of AMGN of why waiting for that trend line break can mean preserving both capital and clarity. The stock is bullish, no doubt about it, as the intermediate uptrend remains intact since it began last August. Since then, we have a series of higher highs and higher lows.
In recent weeks, the stock has been pulling back quietly with some minor profit-taking leaving price drifting lower since the early-February peak. The prior breakout was around $65 (January) so it could be the stock is in for a test of that zone, who is to say otherwise? And until a break occurs to suggest the stock is back on the move, who cares?
Currently, the stock is floundering around beneath a very valid trend line, but no less a trend line which has yet to be crossed.
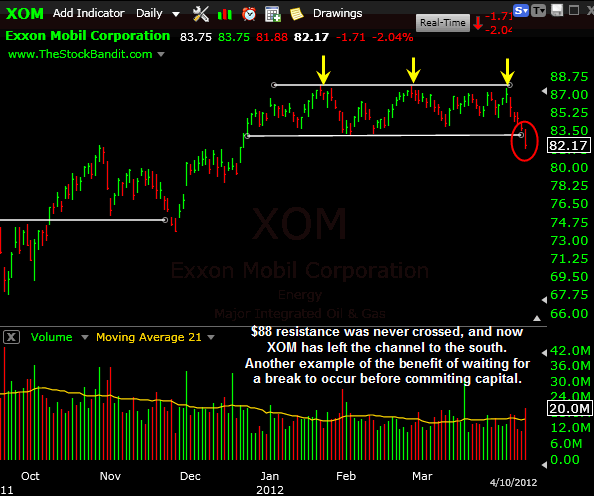
XOM is another example here as just recently the widely-anticipated push through the $88 level as recently as last week never happened. The stock has since fallen out of its channel to the downside. Waiting was the best option.
F is one more on the list with $13.05 resistance never being crossed, despite approaching it multiple times of late. Those who bought early in hopes of getting in “cheaper” ahead of the breakout actually paid up. The stock has exited its trading range to the downside, leaving premature buyers in what I’d call the “hurtin for certain” department.
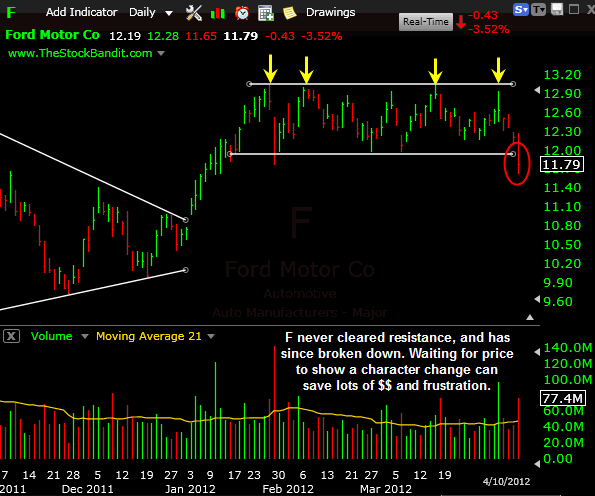
Traders by and large love to predict what’s coming, and often will take anticipatory trades as such. Doing so can be an expensive way to get caught in a stagnant name.
Carefully consider whether a stock is truly getting on the move before committing capital to entries. Could be that waiting a little longer provides you with not only better prices, but better defined exits as well.
Trade Like a Bandit!
Jeff White
Producer of The Bandit Broadcast
Get our free newsletter to keep up!
Follow @TheStockBandit


